Interlace: turning a codebase-intelligence platform into a guided path
Interlace turns a codebase into a knowledge graph that AI assistants query over MCP. I audited its admin application and redesigned the path from uploading code to a working IDE connection.
Decision summary
29 findings across five areas, triaged by impact and effort, and answered by one guided admin path and four system rules.
01 / The product
A powerful engine.
An interface that shows its wiring.
Interlace is AltexSoft's codebase-intelligence platform. It parses source code into a knowledge graph. Developers then query that graph from their AI assistant through MCP, so answers about a large or legacy codebase rest on its actual structure. Getting there takes an admin five separate steps in the web application. That application is what I audited.
- 01
Source code
A ZIP upload, or a GitHub, GitLab or Bitbucket repository.
- 02
Pipeline
LLM-driven parsers read the code in phases.
- 03
Knowledge graph
Services, endpoints, entities and user flows.
- 04
Snapshot
A fixed version of the graph, deployed to a DEV or PROD slot.
- 05
MCP to the AI assistant
The developer asks Cursor or Claude Code, which answers from the graph.
Admin
Creates projects, uploads code, runs pipelines, creates and deploys snapshots, and issues MCP access. Every finding in this audit sits on the admin's path.
Developer
Never needs the web app beyond a token. Their experience starts in the IDE, which is why every broken hand-off upstream reaches them as “the assistant doesn't know our code yet”.
What shaped the recommendations
- Pipelines are LLM-heavy. A single parse can take around 20 minutes and costs real compute. Mistakes late in the flow are expensive, and any automation has to respect cost.
- The team was already moving snapshots and graphs into project scope. Visual navigation fixes could ship at once; structural navigation changes had to follow that migration.
- Interlace is B2B, one tenant per company. The admin is technical, so the interface should save clicks, not teach.
Four terms used on this page
- Pipeline
- One parsing run over the project's code.
- Snapshot
- A frozen graph produced by a pipeline.
- Deploy
- Make a snapshot the graph that assistants query in DEV or PROD.
- MCP
- Model Context Protocol, the way AI assistants connect to tools and data.
02 / My task
Assess the experience.
Leave the team a plan.
I was asked to evaluate the design and UX strategy of the user-facing application: where it helps an admin reach a working MCP connection, where it gets in the way, and what to fix first. I worked on this alone as the product designer. The audit covered the whole application, grouped into five areas: Home, Project flow, Repository, Grid views and Navigation.
03 / How I audited
Walk the real workflow.
Score every break in it.
I went through the full admin workflow on the live build, from an empty project to a working IDE connection, and confirmed the sequence in a walkthrough with the team. Every screen that raised an issue was captured and annotated where it happens.
Method
- Nielsen's usability heuristics. Above all, visibility of system status, match with the real world, and error prevention.
- Hick's and Jakob's laws. Fewer choices and manual steps; patterns that match the tools developers already use.
- WCAG 2.1 AA. Contrast and legibility checked as correctness, not taste.
Priority scale
Each finding was scored on two axes: user impact and implementation effort. The labels express triage, not how desirable a feature is.
- Critical
- Actively misleads users, blocks a key action, or fails WCAG 2.1 AA. A bug in the interaction layer, not an opinion. Fix before anything else ships.
- High
- Significant friction in a primary workflow. Not a blocker, but it erodes confidence and creates recurring support load. Fix in the same release cycle as Critical where scope allows.
- Medium
- Real friction with a workaround, on secondary paths. Address before the product scales.
- Additive
- Nothing is broken; this is net-new capability. Treat it as a hypothesis: prototype, validate with users, then build.
Where the workflow halts
Five steps stand between an empty project and a developer's first answer. Every hand-off between them is manual.
- Step 1
Upload code
The folder has to be named first. Leave it blank and it looks like success.
Manual hand-off - Step 2
Run pipeline
Nothing prompts the run, and progress can sit still for minutes.
Manual hand-off - Step 3
Create snapshot
The admin has to notice completion and find the snapshot screen alone.
Manual hand-off - Step 4
Deploy
Deploying to PROD looks more dangerous than deleting.
Manual hand-off - Step 5
Connect MCP
Setup asks for a hand-merged JSON config.
04 / The audit
29 findings.
Each one on the screen where it happens.
29 findings on 16 screens, in the order an admin meets them. Jump to a group of screens, or read straight through. Every marker points to its finding; every finding says what is wrong, what to change, and where the redesign answers it.
| Area | Critical | High | Medium | Additive | Total |
|---|---|---|---|---|---|
| Home | 0 | 0 | 1 | 0 | 1 |
| Project flow | 2 | 3 | 13 | 0 | 18 |
| Repository | 0 | 0 | 1 | 0 | 1 |
| Grid views | 2 | 1 | 1 | 1 | 5 |
| Navigation | 1 | 2 | 1 | 0 | 4 |
| All | 5 | 6 | 17 | 1 | 29 |
Most friction sits in the project flow, the path every admin has to take. The Critical findings are spread across four of the five areas.
The five Critical findings
- Critical A blank folder name fakes a successful upload Nothing is processed, and nothing says so.
- Critical Deploying to PROD looks more dangerous than deleting The colour of danger marks a normal step.
- Critical Table headers fail contrast and break the type system Headers fall below WCAG 2.1 AA contrast.
- Critical Blue IDs look like links but do nothing A false affordance in every table.
- Critical Inside a project, the navigation forgets where you are Global and project-scoped lists look the same.
Actively misleads users, blocks a key action, or fails WCAG 2.1 AA. A bug in the interaction layer, not an opinion. Fix before anything else ships.
Home
Home dashboard
Open full size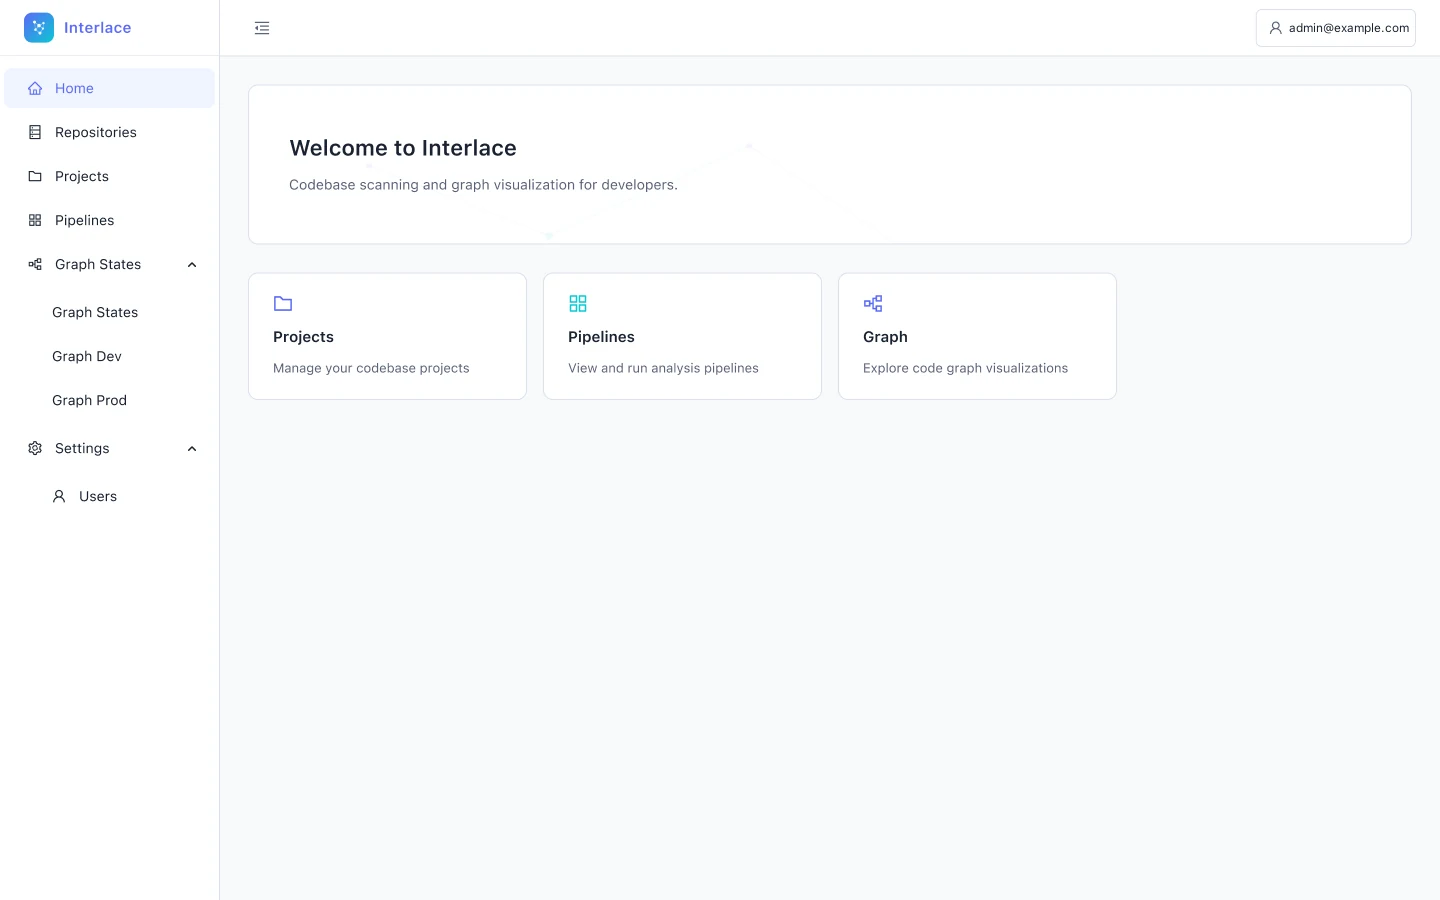
-
The home dashboard says almost nothing
Problem
Home shows a welcome banner and three cards that link to Projects, Pipelines and Graph, and none of them carries data. The first screen after sign-in can't tell the admin whether anything needs attention.
Fix
Turn the cards into telemetry: counts of projects, pipelines and graphs, plus status badges (Done, Failed, Pending) for the most recent pipelines.
Visibility of system status
See it fixed in the redesign: step 1, Project home
Projects
Projects list
Open full size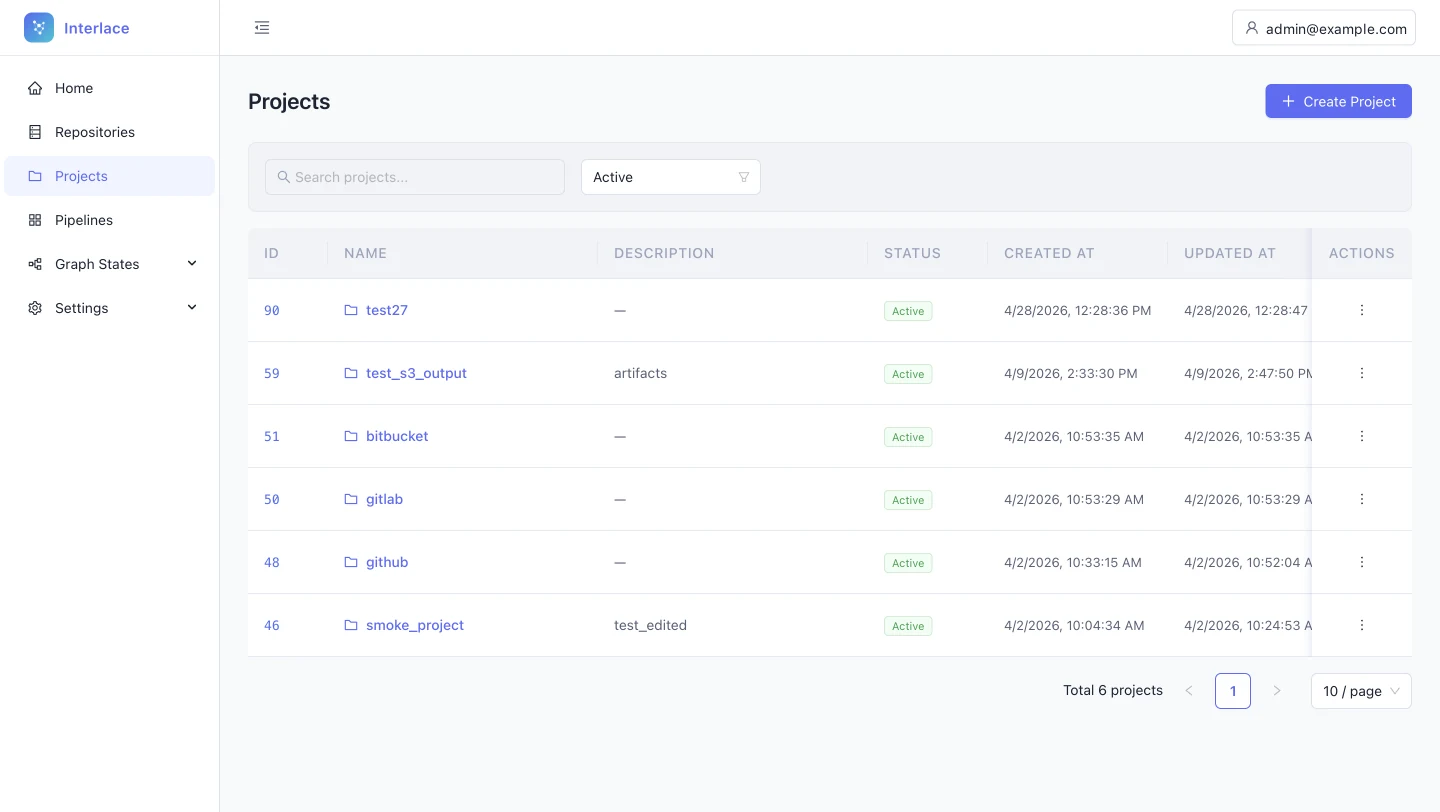
-
The projects table lists database fields, not project health
Problem
The projects table has six columns: ID, Name, Description, Status, Created at and Updated at. Four are administrative metadata, and nothing shows pipelines, graphs or code. To learn whether a pipeline failed or a graph is live, the admin has to open each project.
Fix
Add operational columns: linked repositories, last pipeline status, and deployment (DEV, PROD or none). Remove Created at and rename Updated at to Last activity, which also avoids horizontal scrolling.
Visibility of system status; recognition rather than recall
See the rule: rule 1, tables -
Each table handles row actions differently
Problem
Snapshots stack a solid View button, a Deploy dropdown and a trash icon. Pipelines mix text links with red icons. Repositories and Projects use a kebab menu. Every table has to be learned separately, and visual weight no longer signals importance.
Fix
Use one global pattern. A kebab menu holds the secondary actions, with at most one standalone icon for a critical action. Apply it the same way in every table.
Consistency and standards
See the rule: rule 1, tables -
Table headers fail contrast and break the type system
Problem
Headers such as NAME, STATUS and ACTIONS use a light grey that appears to fall below WCAG 2.1 AA contrast, and they are set in all caps, which the product uses nowhere else. A contrast failure is a correctness problem, not a style preference.
Fix
Darken the headers to at least 4.5:1 and set them in sentence case (Name, Status, Actions).
Accessibility (WCAG 2.1 AA); consistency and standards
See the rule: rule 1, tables -
Blue IDs look like links but do nothing
Problem
Pipeline IDs (#7, #6) and project IDs are set in the link colour but are not clickable. Blue text in a table reads as a link, so static blue text causes misclicks and erodes trust in every other signal.
Fix
Make the identifier the link to the detail view. If it has to stay static, set it in the body text colour.
Consistency and standards; error prevention
See the rule: rule 1, tables -
Grids have no summary of system health
Problem
Every grid lists rows with a pagination count and nothing above them. Questions like “how many pipelines failed today?” need mental arithmetic or a scan of every row.
Fix
- Projects: total, active pipelines, failed pipelines.
- Pipelines: runs in 30 days, success rate, running now, average duration.
- Snapshots: total, storage used, active deployments.
- Repositories: connected sources, last synced, sync errors.
- A hypothesis to prototype and validate.
Flexibility and efficiency of use
See the rule: rule 1, tables
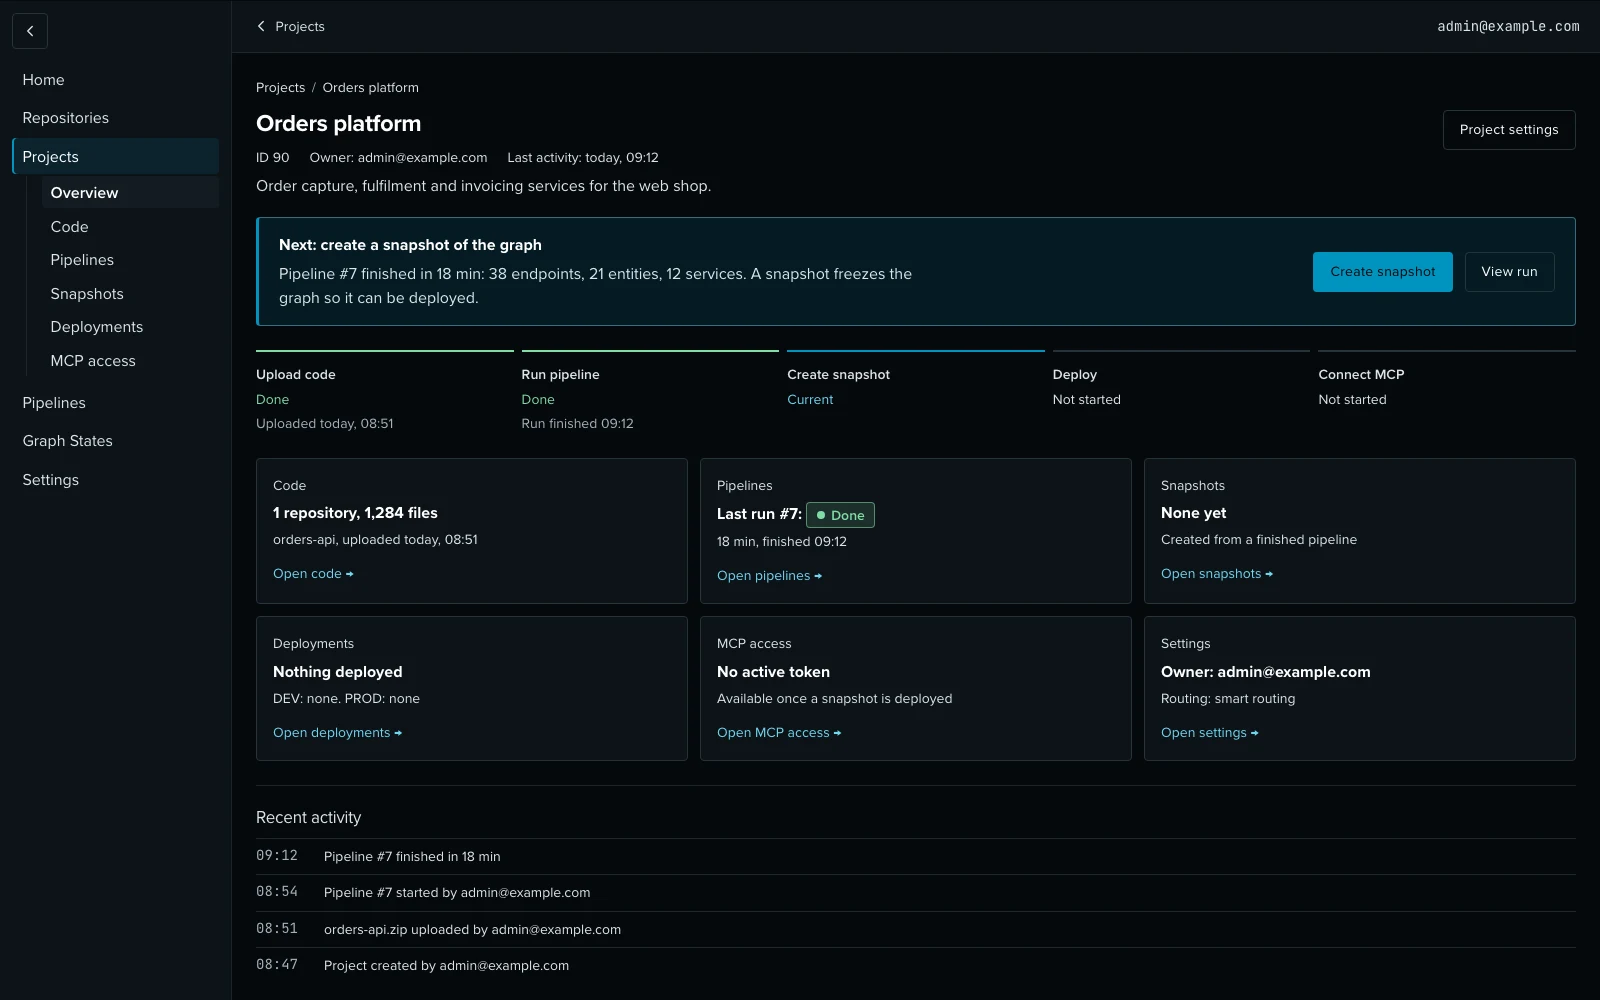
Project dashboard
Open full size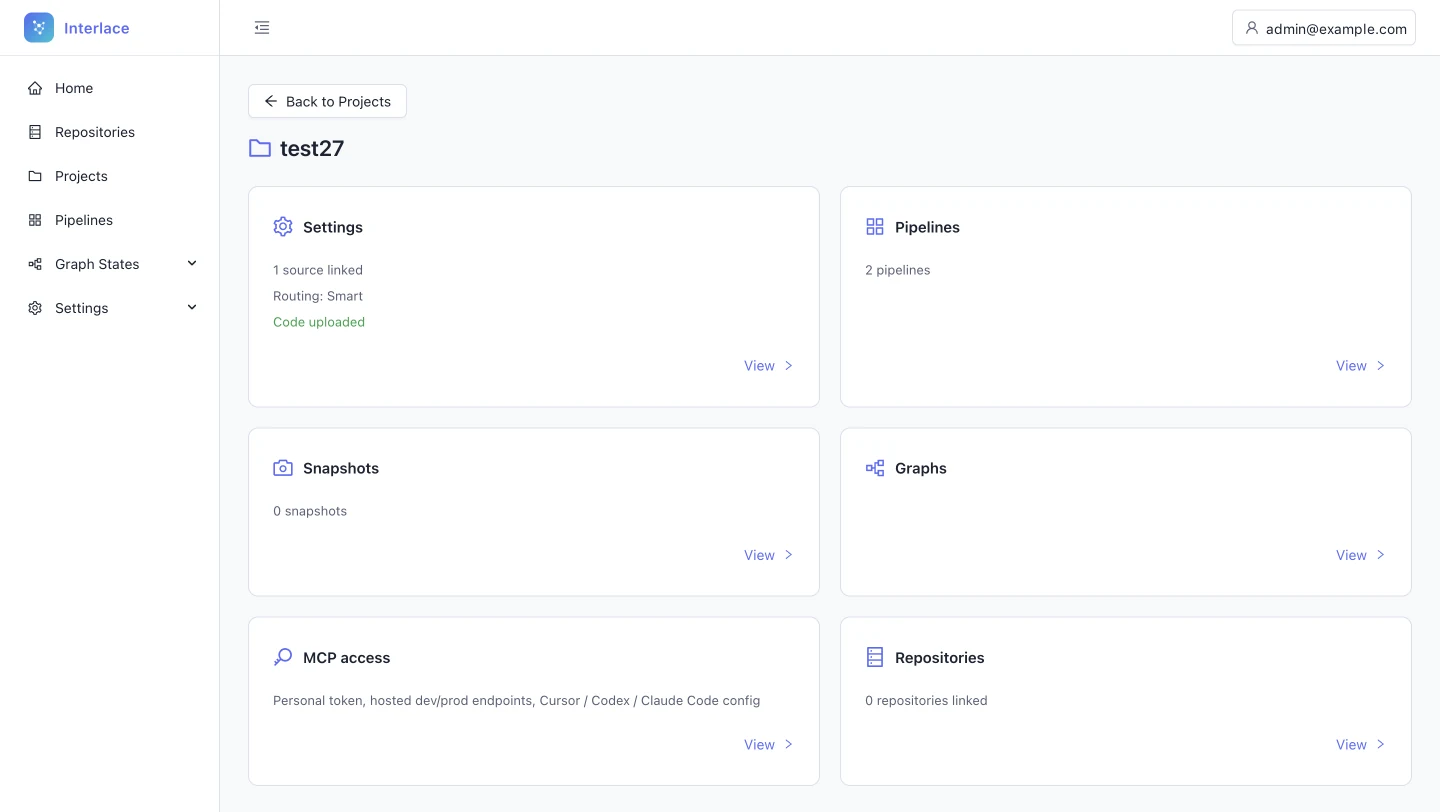
-
The project page hides its own context
Problem
The project header shows only a folder icon and the name. The ID, description, owner and dates live in Settings, so anyone opening the project has to go elsewhere to learn what it is.
Fix
Use the empty space under the title for a meta line: project ID, description, owner and last update.
Recognition rather than recall
See it fixed in the redesign: step 1, Project home -
Dashboard cards count things instead of reporting status
Problem
The dashboard cards say “2 pipelines” or “0 snapshots”, but not whether the latest run succeeded or whether anything is deployed. The numbers are true but not useful: the admin still has to open each section.
Fix
- Pipelines: the latest run's status and progress, with Rerun on failure.
- Snapshots: the latest date and deployment.
- MCP access: token state and last rotation.
Visibility of system status
See it fixed in the redesign: step 1, Project home -
Nothing tells a new project what to do first
Problem
Six cards carry equal weight, although the workflow is strictly sequential: upload code, run a pipeline, create a snapshot, deploy, use MCP. A new admin has to discover the order by trial and error.
Fix
Add a next-step area whose primary action follows the project's state. For example, “Upload code and start analysis” when there are no pipelines, and “Create snapshot” when a run has just finished.
Help and documentation; error prevention
See it fixed in the redesign: step 1, Project home -
Inside a project, the navigation forgets where you are
Described on Projects list -
The sidebar toggle lives outside the sidebar
Described on Projects list
Uploading code
Project settings: code upload
Open full size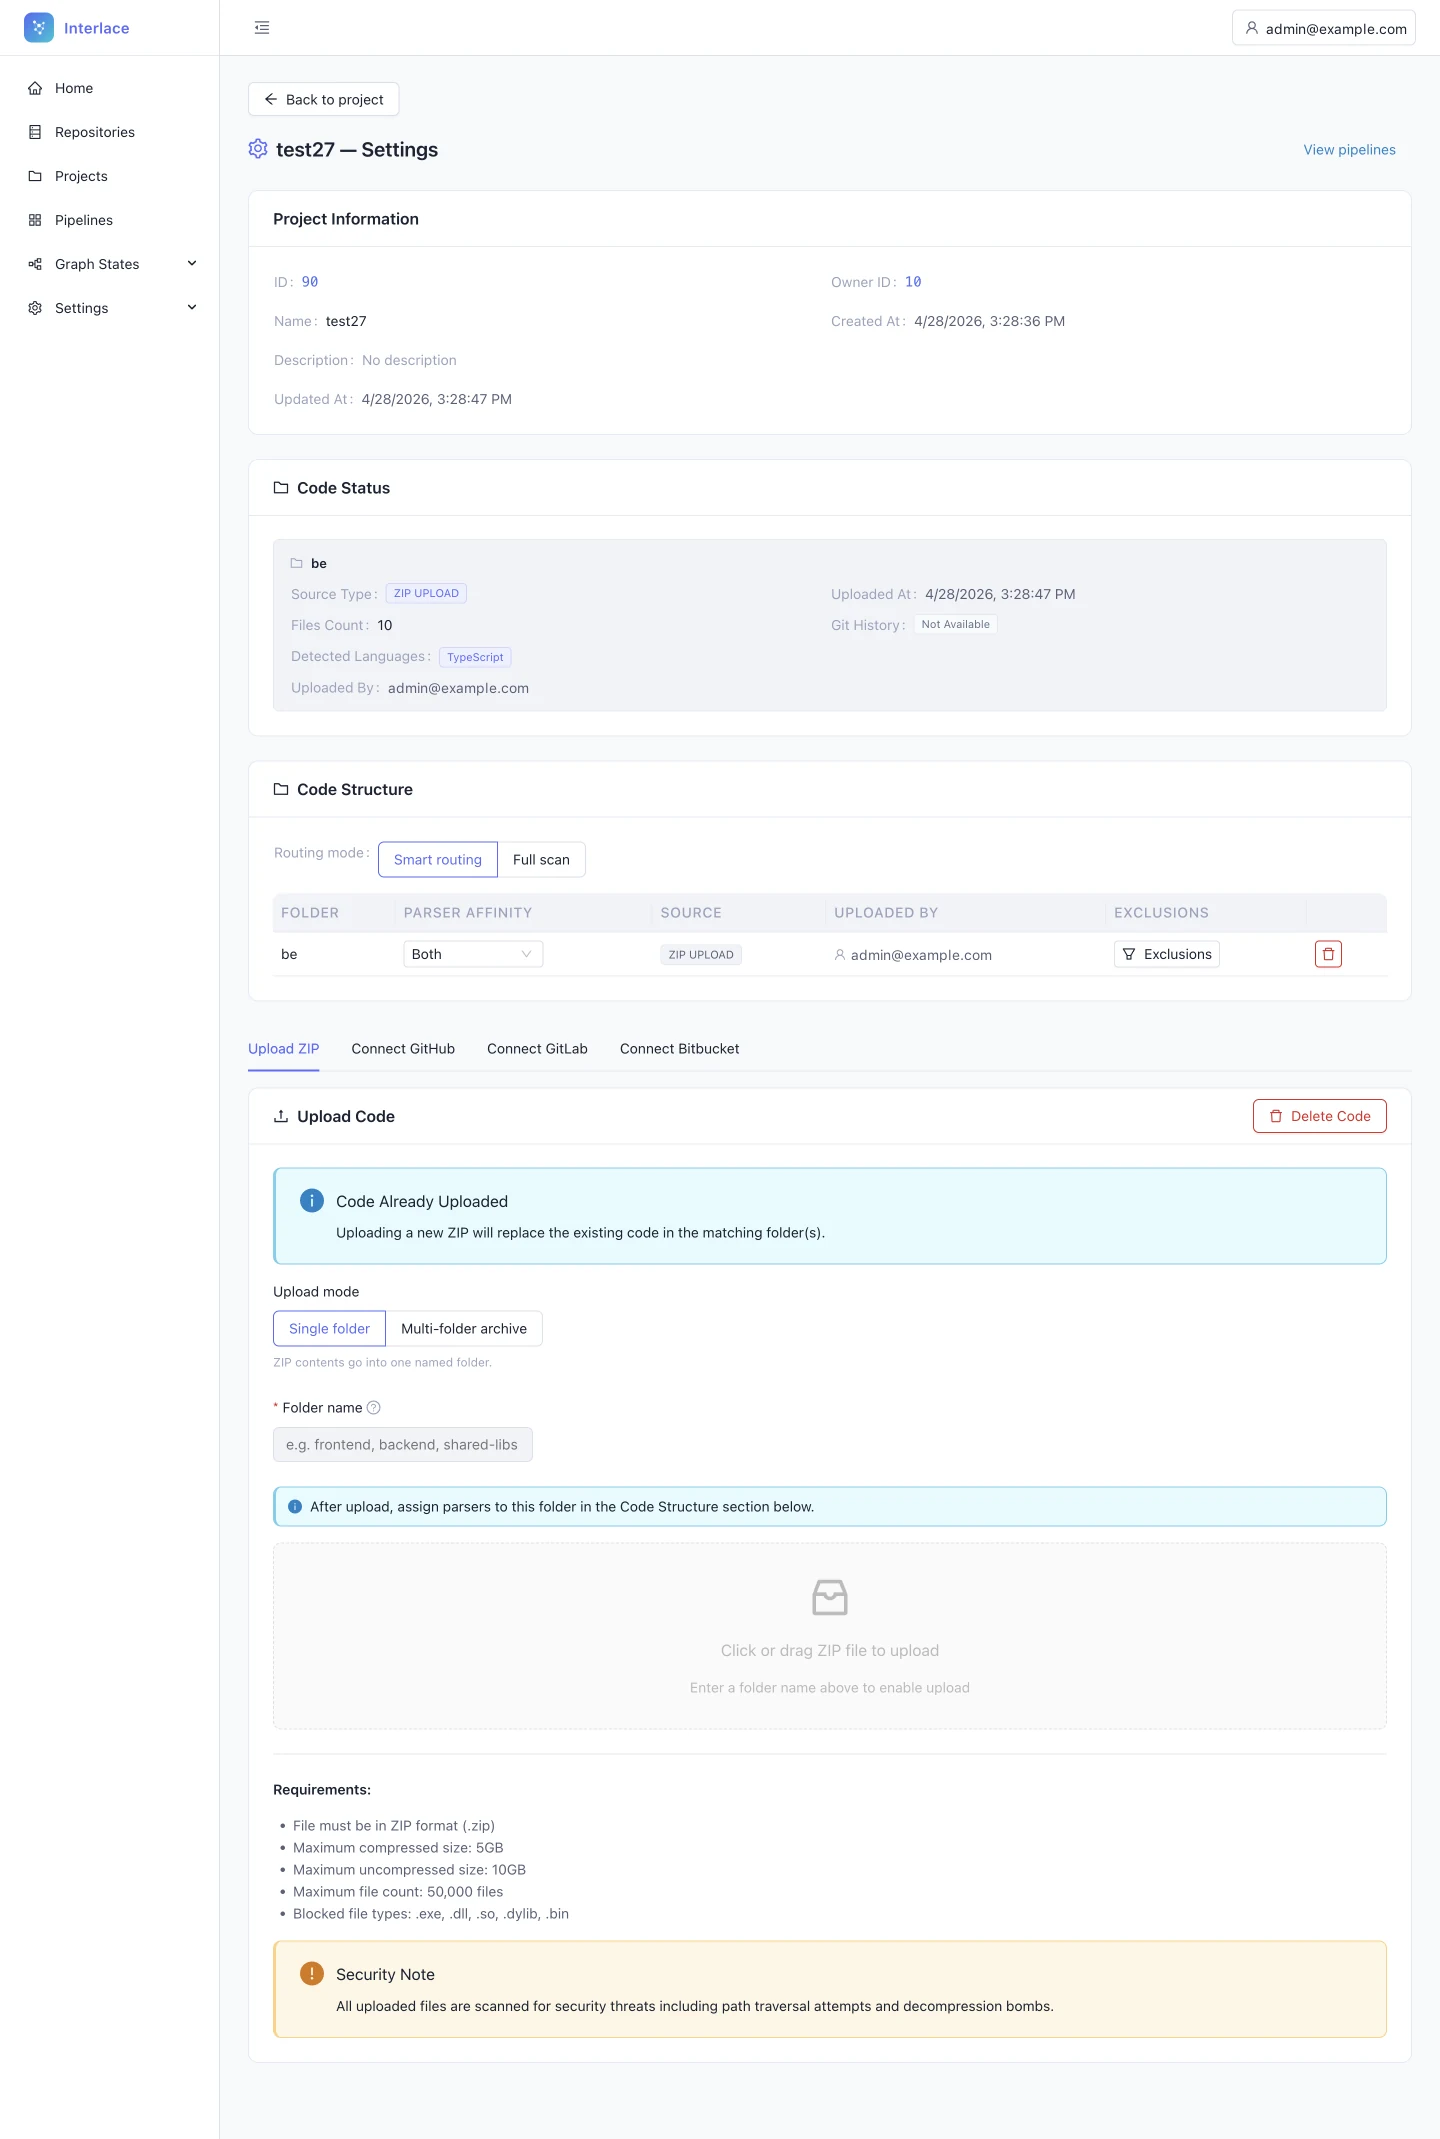
-
A blank folder name fakes a successful upload
Problem
Uploading a ZIP requires a folder name first. Left blank, the interface behaves as if the upload succeeded, but nothing is processed. A silent failure at the first step breaks everything after it, and the admin finds out much later.
Fix
Remove the up-front field and derive the folder name from the ZIP file name. Keep it editable.
Error prevention; match between system and the real world
See it fixed in the redesign: step 2, Add code -
Uploads merge silently, and folders can't be renamed
Problem
Uploading to an existing folder name merges the two without warning, and a folder can't be renamed once it exists. Silent merges risk corrupting the code the graph is built from.
Fix
On a duplicate name, ask whether to merge or to upload a new version (for example backend_v2). Add an inline Rename action to the code structure table.
User control and freedom
See it fixed in the redesign: step 2, Add code -
After upload, the next step is manual
Problem
Once code is uploaded, the admin has to navigate to Pipelines and start the analysis by hand. The flow stops at the moment the admin is most ready to continue.
Fix
On success, offer the next step in place: “Code uploaded. Run pipeline now.”
Flexibility and efficiency of use
See it fixed in the redesign: step 3, Run pipeline
Project repositories
Open full size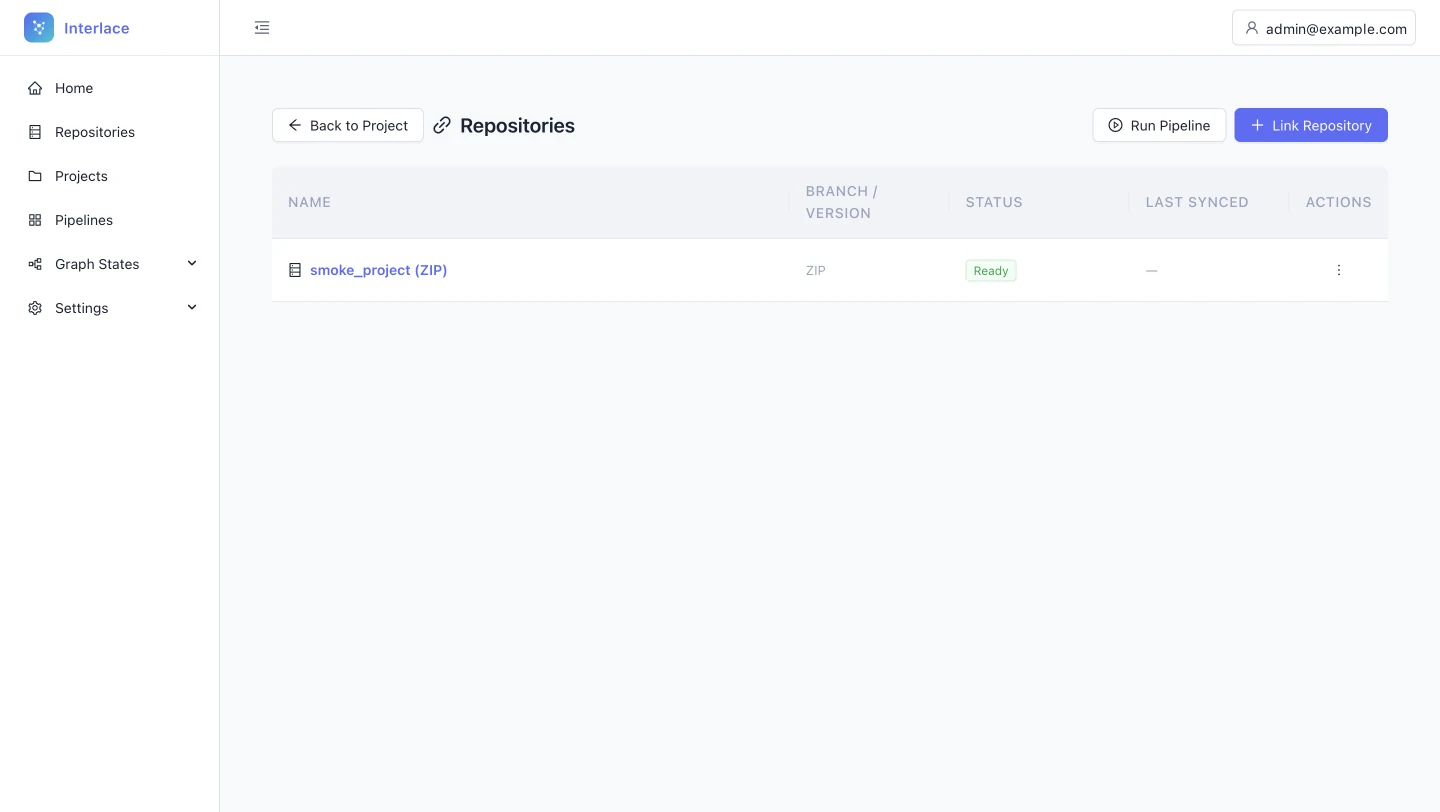
-
“Run Pipeline” doesn't say what it runs
Problem
On the project's Repositories page, Run Pipeline sits next to Link repository. It could run for the listed repositories, for the whole project, or simply open Pipelines. Ambiguity is expensive when a run takes around 20 minutes.
Fix
Name it for what it does. If it navigates, use “Go to pipelines”. If it starts a project-wide run, use “Run project pipeline” and put it behind a confirmation.
Match between system and the real world; error prevention
See it fixed in the redesign: step 3, Run pipeline -
Each table handles row actions differently
Described on Projects list -
Table headers fail contrast and break the type system
Described on Projects list -
Grids have no summary of system health
Described on Projects list -
Inside a project, the navigation forgets where you are
Described on Projects list -
The sidebar toggle lives outside the sidebar
Described on Projects list -
Back and the page title compete for one row
Described on Project dashboard -
Every table opens details differently
Described on Projects list
Linked repository: upload new version
Open full size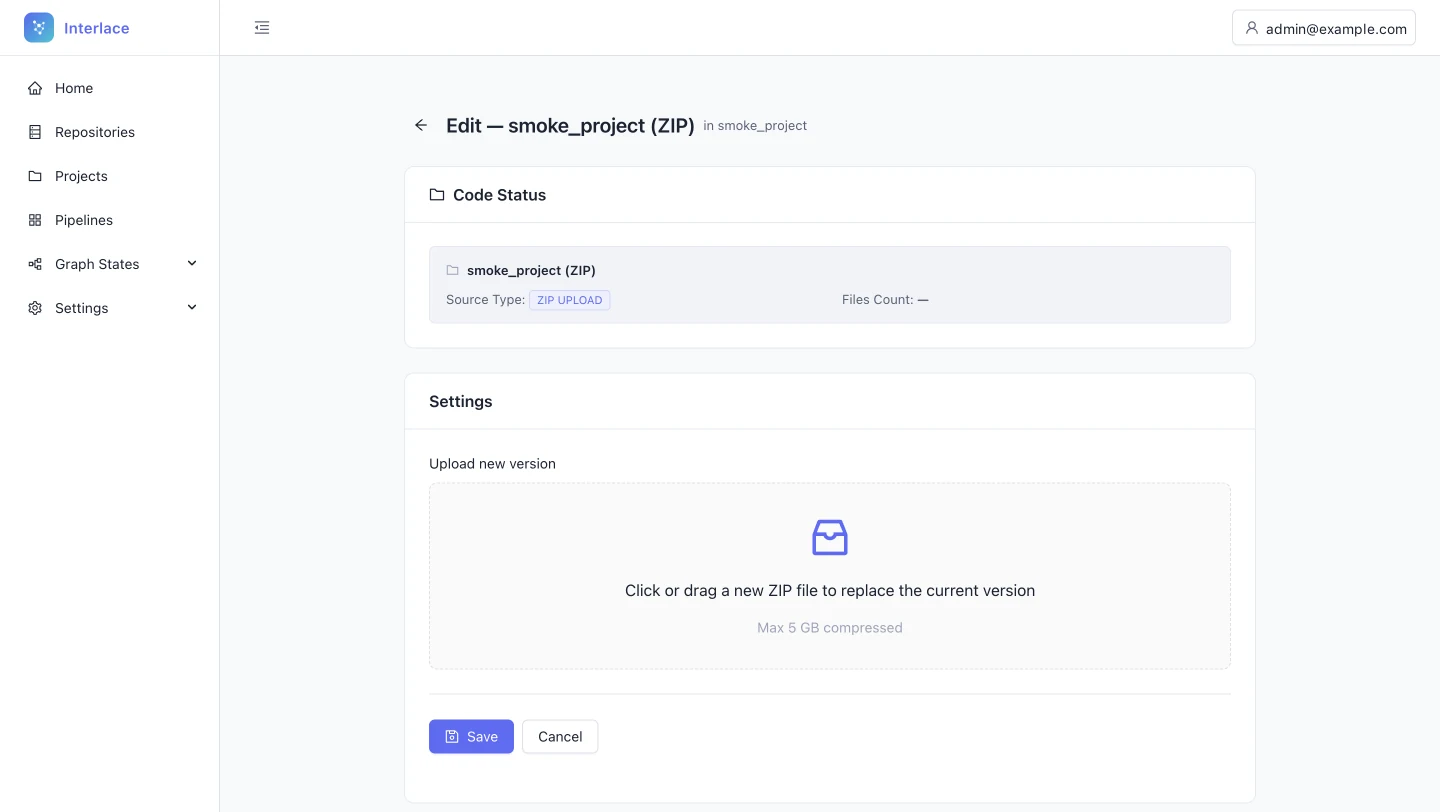
-
The “Edit” page can only replace a file, and Save is always on
Problem
The page is titled “Edit — smoke_project (ZIP)”, but its only capability is uploading a new version, and the primary Save button is active before any file is staged. “Edit” promises a form, and an active Save with nothing to save invites a click that appears to do nothing.
Fix
Title the page Update repository. Keep the primary action disabled until a valid ZIP is staged, then label it Upload and replace.
Match between system and the real world; error prevention
See the rule: rule 3, inputs -
No record of what is about to be overwritten
Problem
The Code status card shows the files count as “—” and leaves out Uploaded at and Uploaded by, both of which Project settings does show. Before replacing a repository, an admin needs to know what is there, who put it there, and when.
Fix
Show the last upload date and author. If parsing hasn't happened yet, say “Pending analysis” instead of showing a dash.
Visibility of system status; recognition rather than recall
See the rule: rule 3, inputs -
Replacing code looks as harmless as a first upload
Problem
The upload zone for a new version looks identical to a first upload, although replacing source code affects pipelines, graphs and snapshots. A consequential action gets no more care than a routine one.
Fix
Add an inline warning above the zone: “Uploading a new version replaces the existing codebase. Run a new pipeline to update the graph.”
Help users recognise, diagnose and recover from errors
See it fixed in the redesign: step 2, Add code
Repositories list
Open full size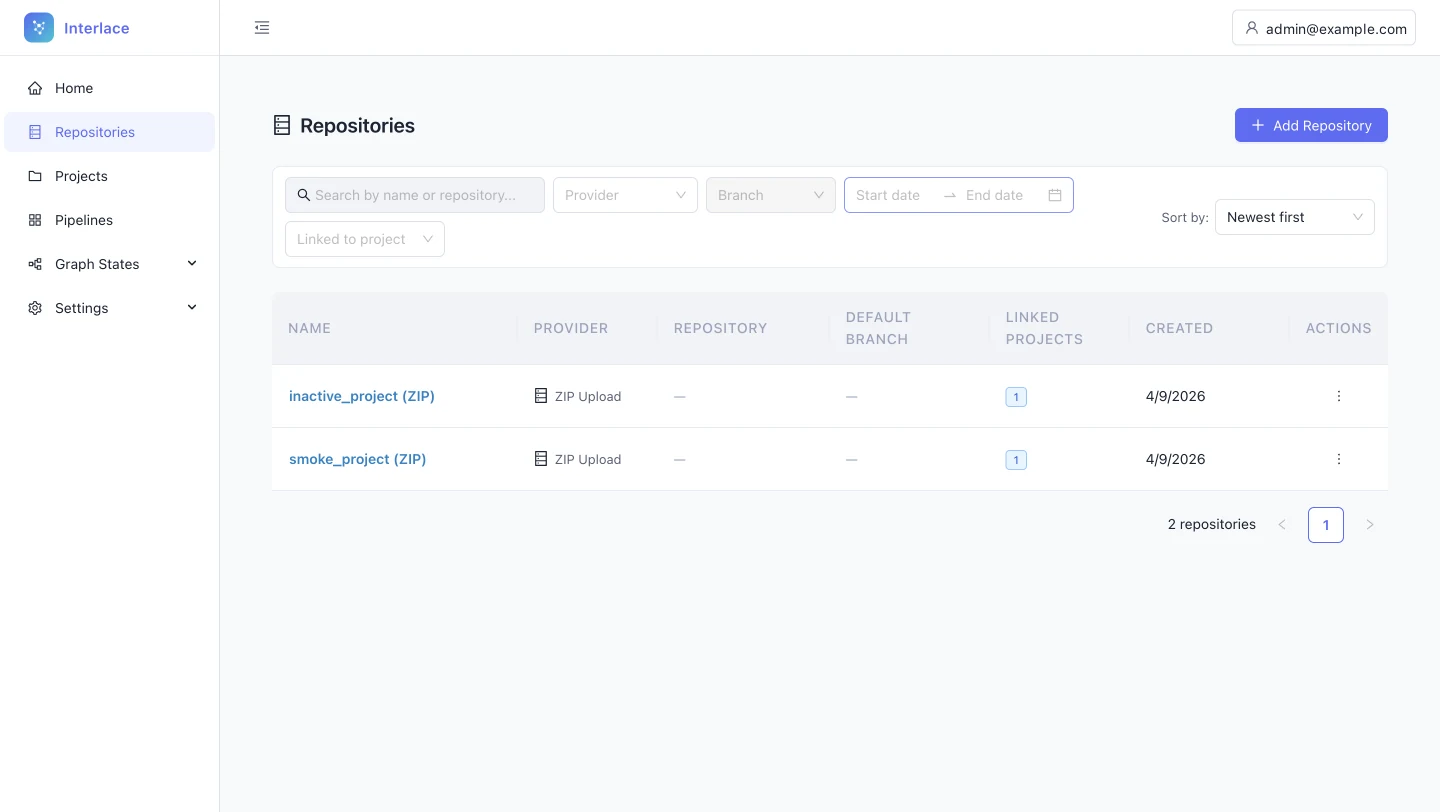
-
Each table handles row actions differently
Described on Projects list -
Table headers fail contrast and break the type system
Described on Projects list -
Grids have no summary of system health
Described on Projects list -
Filter inputs disagree, and disabled fields almost vanish
Problem
Search has its icon on the left, the date picker on the right, and the disabled Branch and Linked to project dropdowns are so faint they look like rendering errors. Users with screen glare or low vision may not realise the filters exist.
Fix
- Standardise the inputs: border, radius, type, padding, and icon placement, with descriptive icons on the left and action icons on the right.
- Explain disabled fields with a tooltip, for example “Branch isn't available for ZIP uploads.”
Consistency and standards; aesthetic and minimalist design; accessibility
See the rule: rule 3, inputs -
The sidebar toggle lives outside the sidebar
Described on Projects list -
Every table opens details differently
Described on Projects list
Add repository: GitHub token
Open full size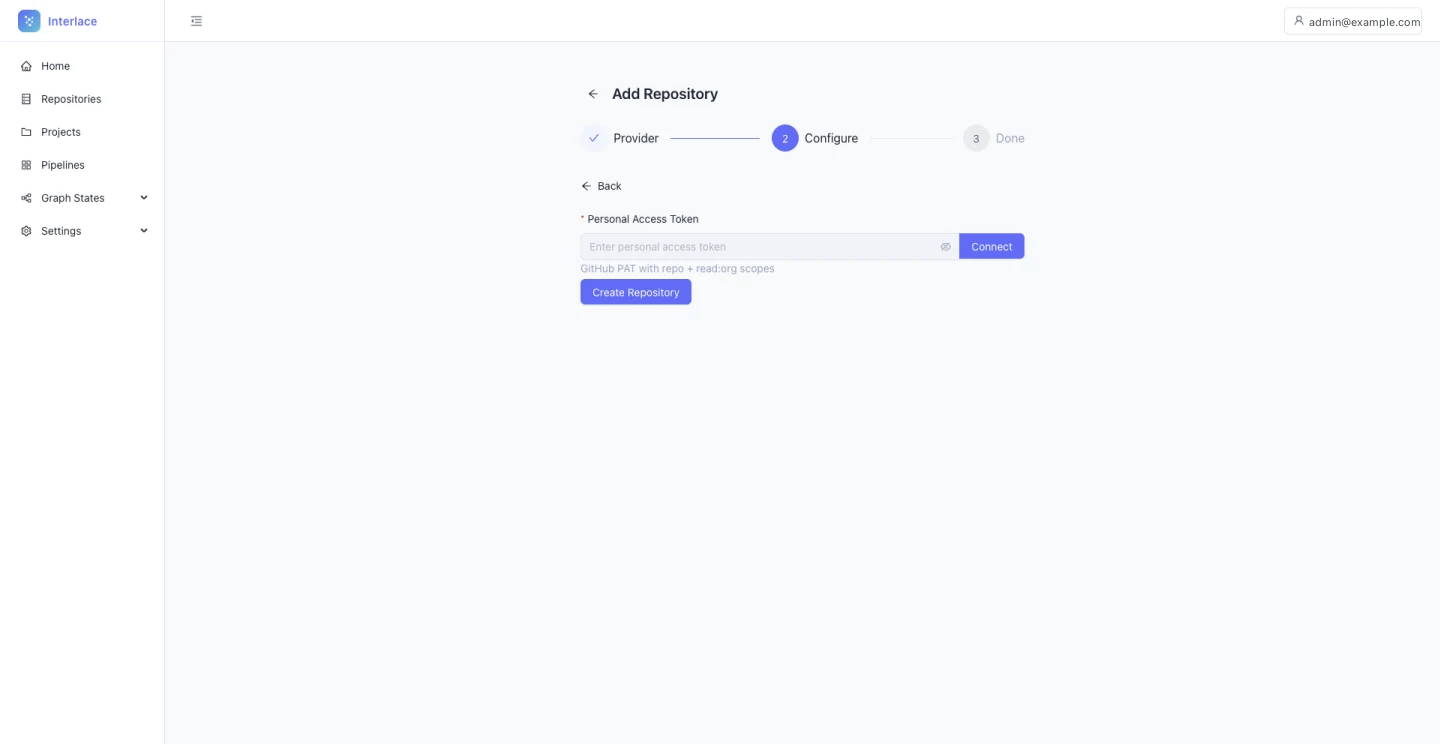
-
Getting a Git token means leaving the flow
Problem
Linking GitHub or GitLab needs a personal access token. The interface names the scopes, but the admin still has to find the token page in the provider's settings and come back. A technical user doesn't need instructions here, just a shorter route.
Fix
Turn the helper text into a deep link to the provider's token page, for example “Create a token on GitHub”. The audit estimates this saves 5 to 7 clicks.
Flexibility and efficiency of use
See it fixed in the redesign: step 2, Add code
Running the pipeline
Pipeline detail
Open full size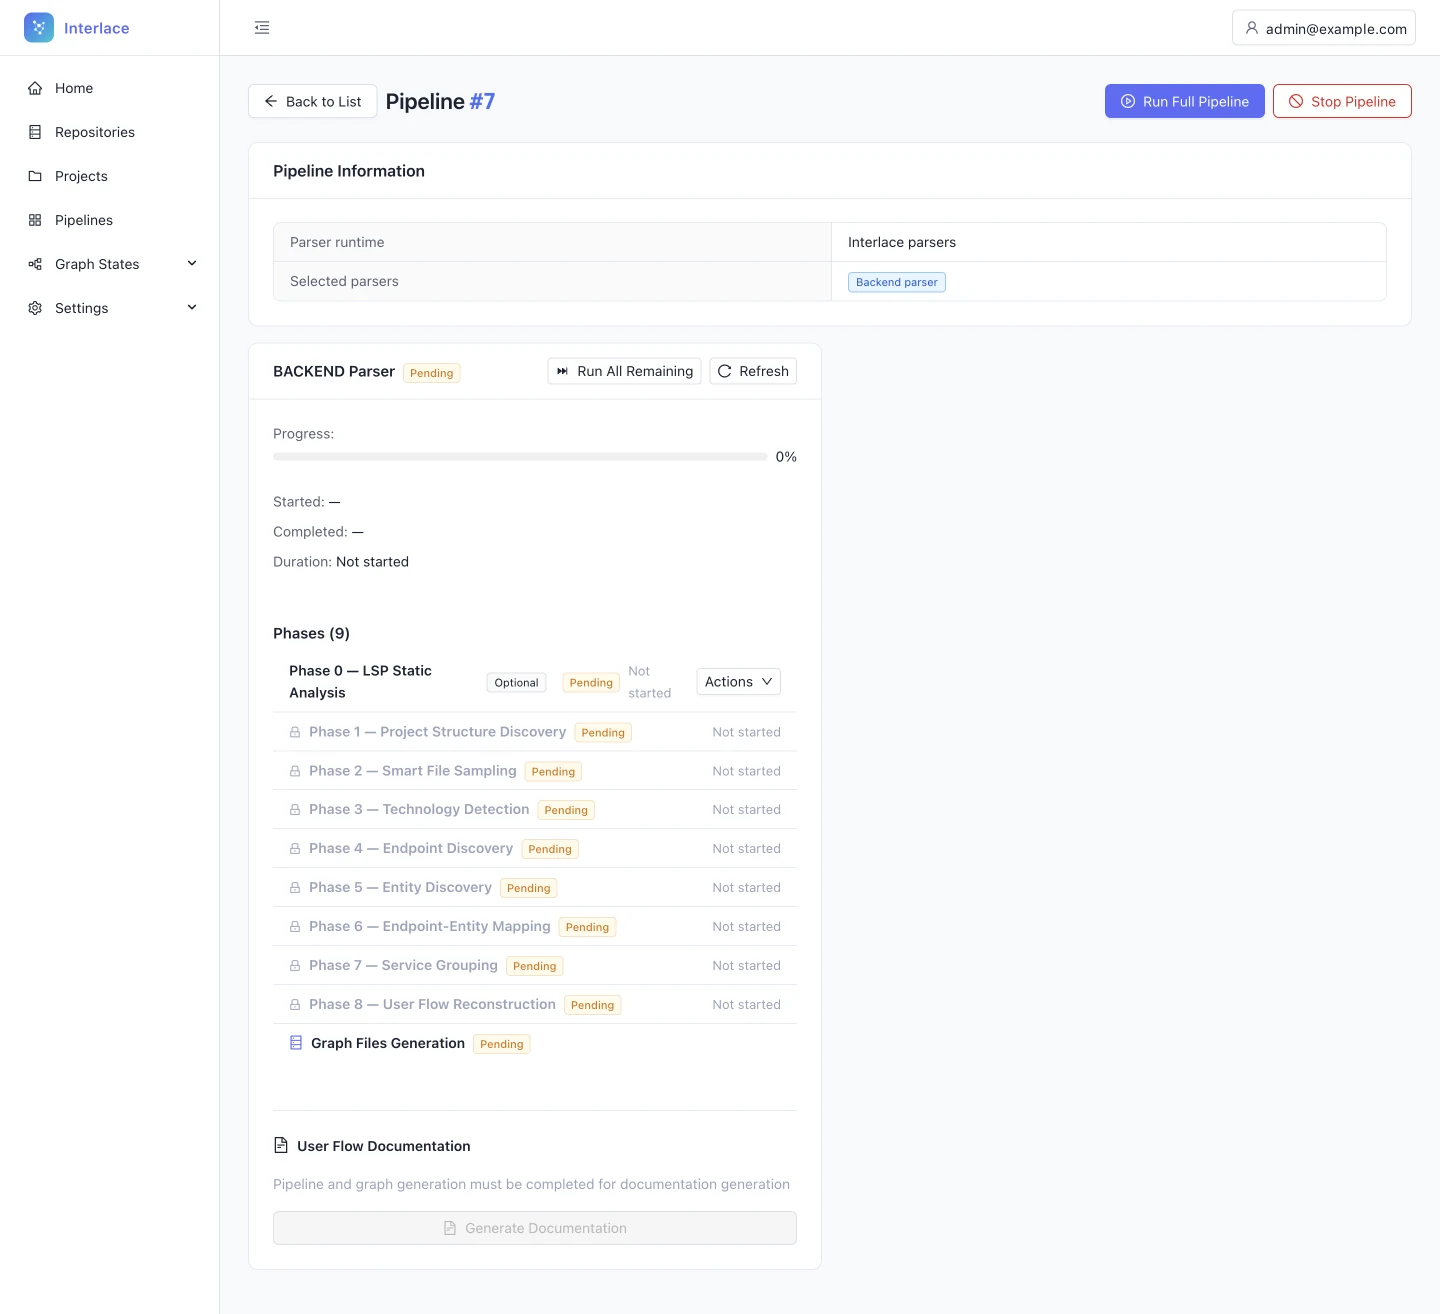
-
A running pipeline can look frozen
Problem
The progress bar can stay still for minutes, with no movement or detail to show that work continues. Admins may assume a silent failure and cancel a healthy run.
Fix
- An indeterminate indicator on the active phase.
- A sub-status such as “Analysing file 45 of 300”.
- The elapsed time.
Visibility of system status
See it fixed in the redesign: step 3, Run pipeline
Pipeline running
Open full size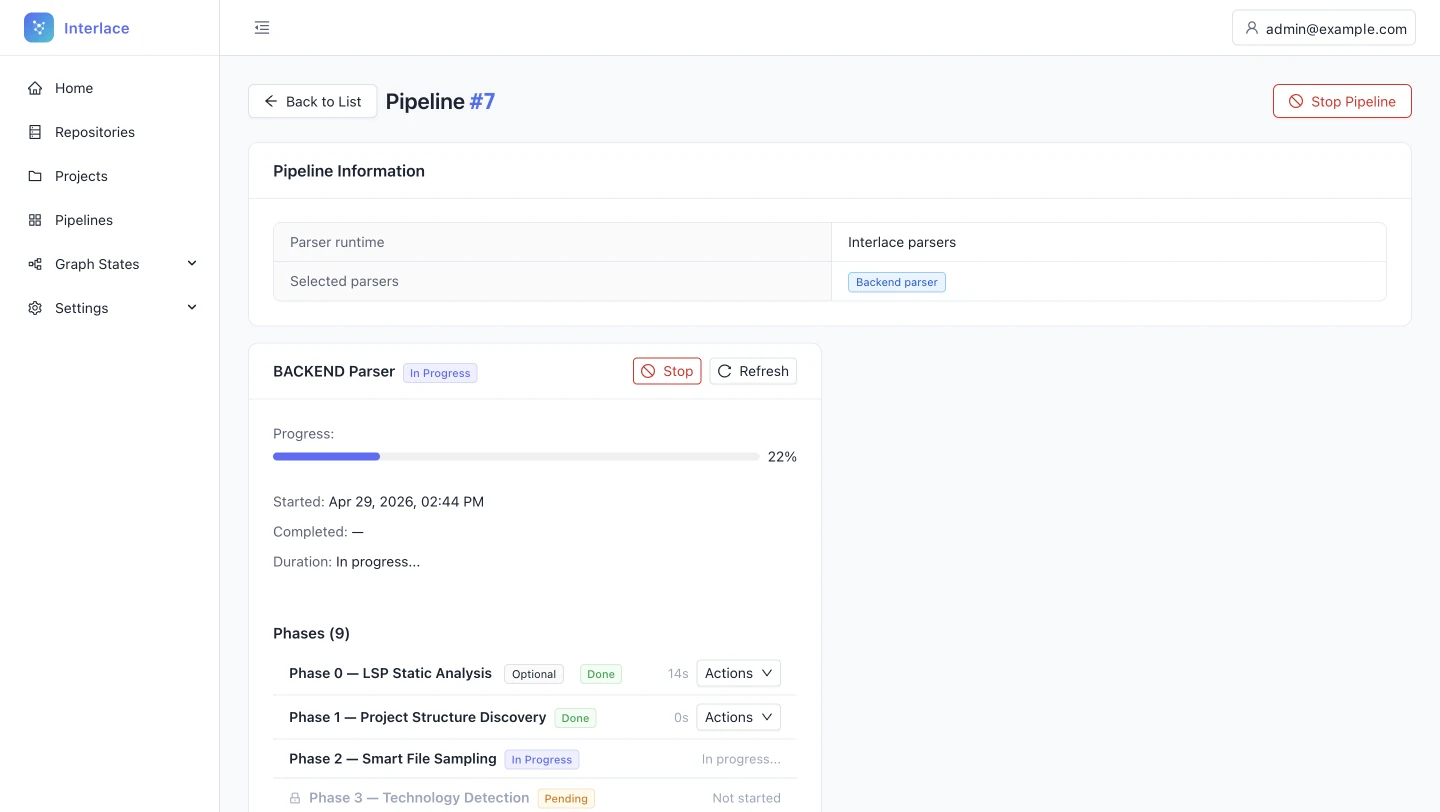
-
Recovery actions hide in per-phase dropdowns
Problem
Rerun phase sits inside a small Actions menu on every phase, and the overall progress and the phase list carry the same visual weight. The one action a failed phase needs is the hardest to find.
Fix
When a phase fails, show Rerun directly on that row.
Recognition rather than recall; aesthetic and minimalist design
See it fixed in the redesign: step 3, Run pipeline
Pipeline completed
Open full size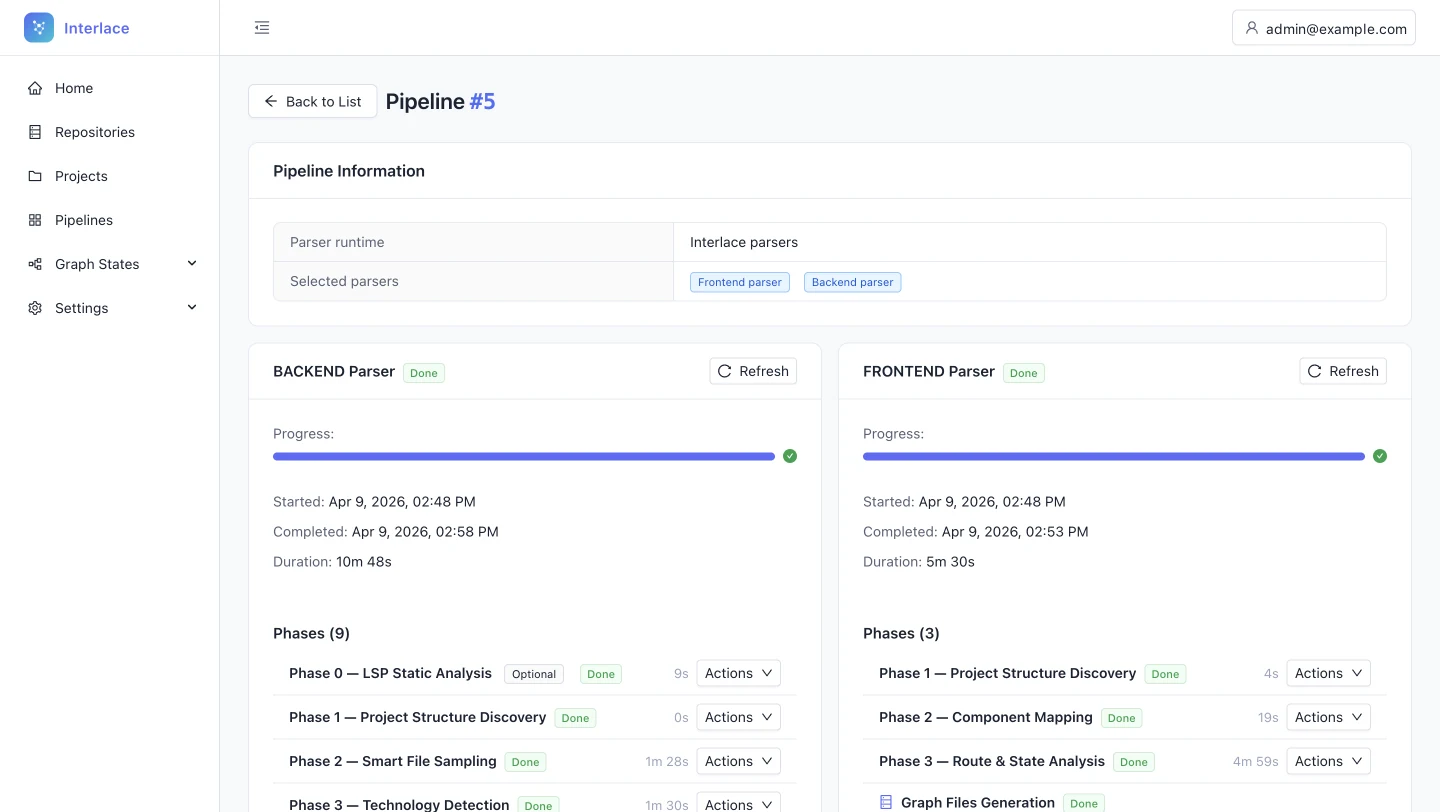
-
The workflow stalls after a successful run
Problem
When a pipeline finishes, nothing leads on. The admin has to notice it is done, go to Graph States and start a snapshot, so the step that turns a run into something usable depends on memory.
Fix
On completion, show a persistent notice with Create snapshot. Put the same action on the completed pipeline's page.
Flexibility and efficiency of use; recognition rather than recall
See it fixed in the redesign: step 4, Snapshot
Project pipelines list
Open full size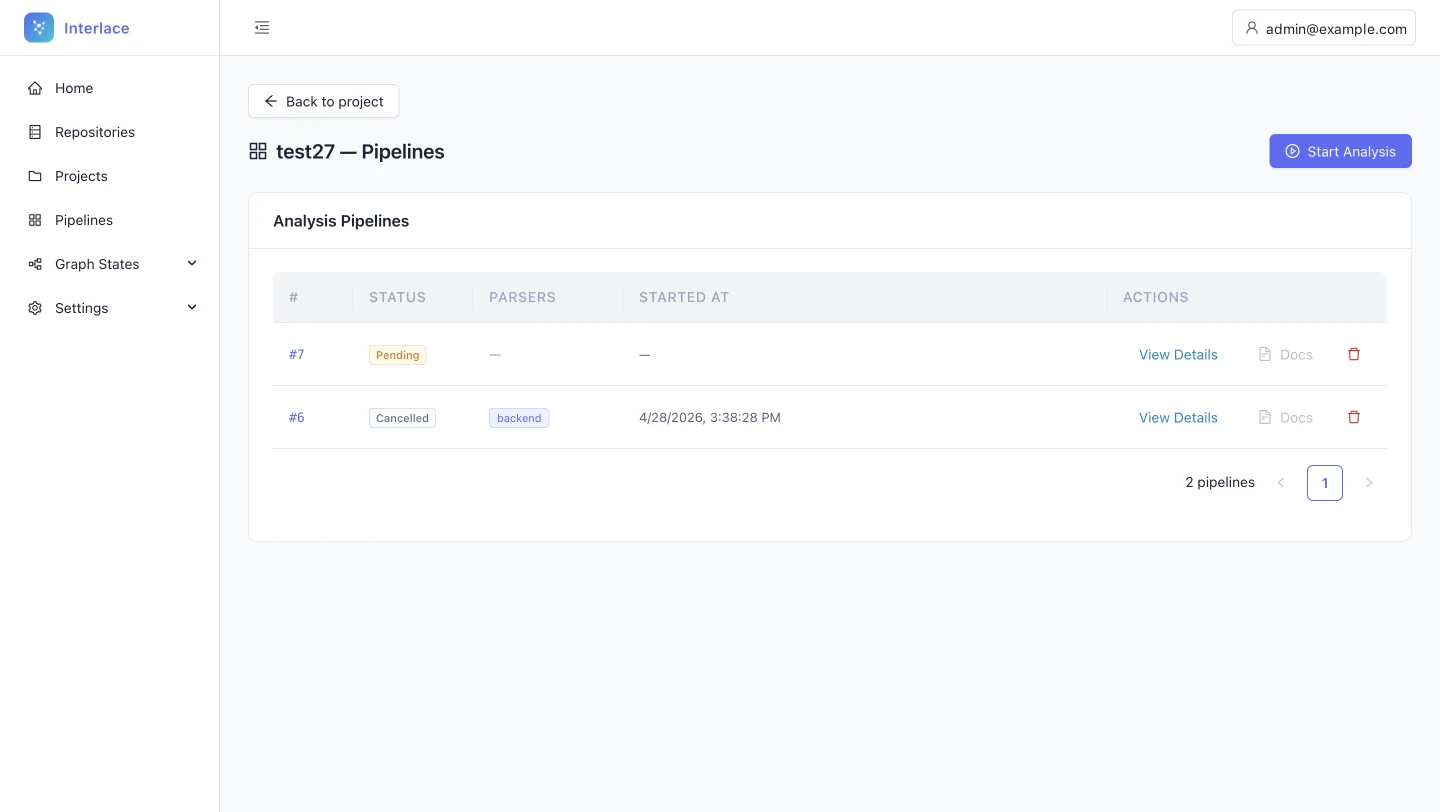
-
Each table handles row actions differently
Described on Projects list -
Table headers fail contrast and break the type system
Described on Projects list -
Blue IDs look like links but do nothing
Described on Projects list -
Grids have no summary of system health
Described on Projects list -
Inside a project, the navigation forgets where you are
Described on Projects list -
The sidebar toggle lives outside the sidebar
Described on Projects list -
Back and the page title compete for one row
Described on Project dashboard -
Every table opens details differently
Described on Projects list
Snapshot and deploy
Project snapshots list
Open full size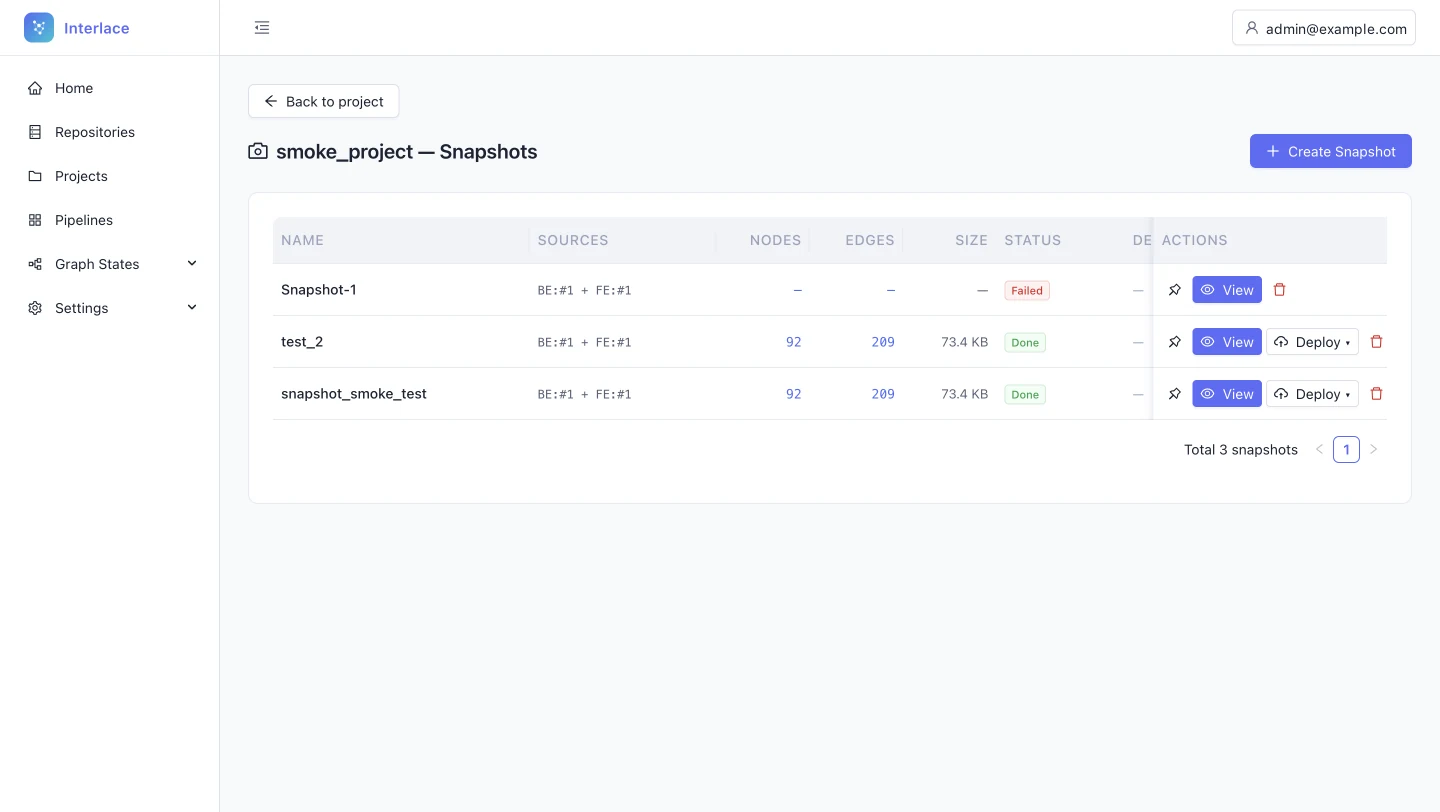
-
Each table handles row actions differently
Described on Projects list -
Table headers fail contrast and break the type system
Described on Projects list -
Blue IDs look like links but do nothing
Described on Projects list -
Grids have no summary of system health
Described on Projects list -
Inside a project, the navigation forgets where you are
Described on Projects list -
The sidebar toggle lives outside the sidebar
Described on Projects list -
Back and the page title compete for one row
Described on Project dashboard -
Every table opens details differently
Described on Projects list
Snapshot detail: deployment
Open full size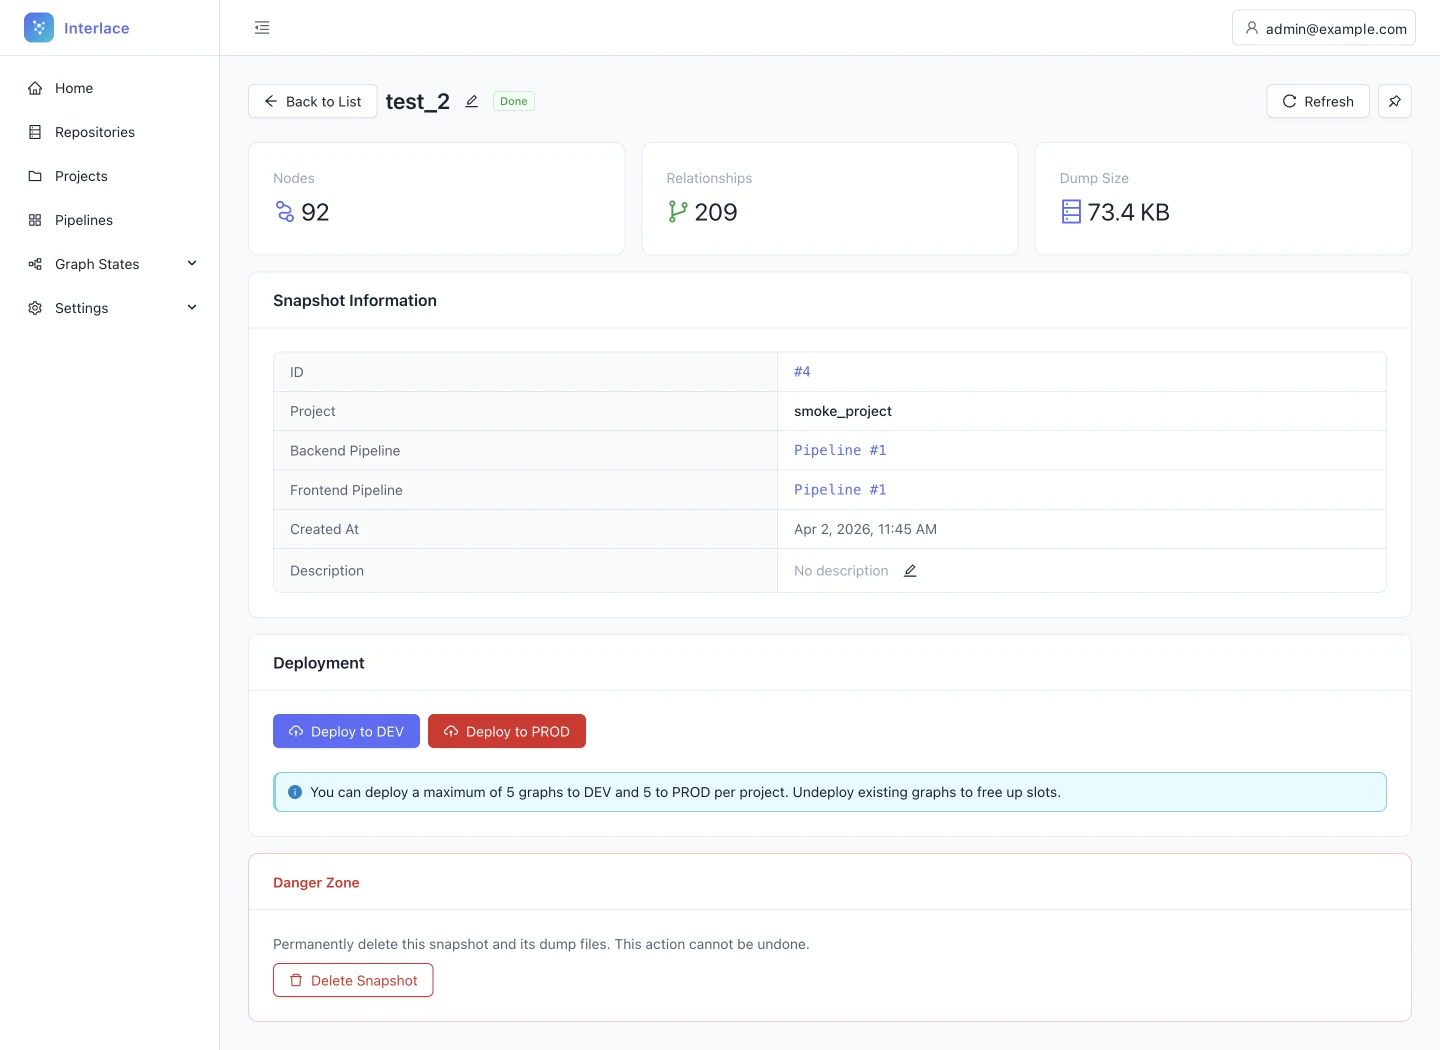
-
Deploying to PROD looks more dangerous than deleting
Problem
Deploy to PROD is a solid red button, and below it Delete snapshot is an outlined red button. Red should mean irreversible loss. Here it marks a normal workflow step, and the real danger reads as secondary.
Fix
- Use the primary colour for deployment, with DEV as secondary and PROD as primary.
- Protect PROD with friction instead of colour: a confirmation that asks the admin to type PROD.
- Keep Delete the only red action, or move it into an overflow menu.
Consistency and standards; error prevention
See it fixed in the redesign: step 5, Deploy
Snapshot failed
Open full size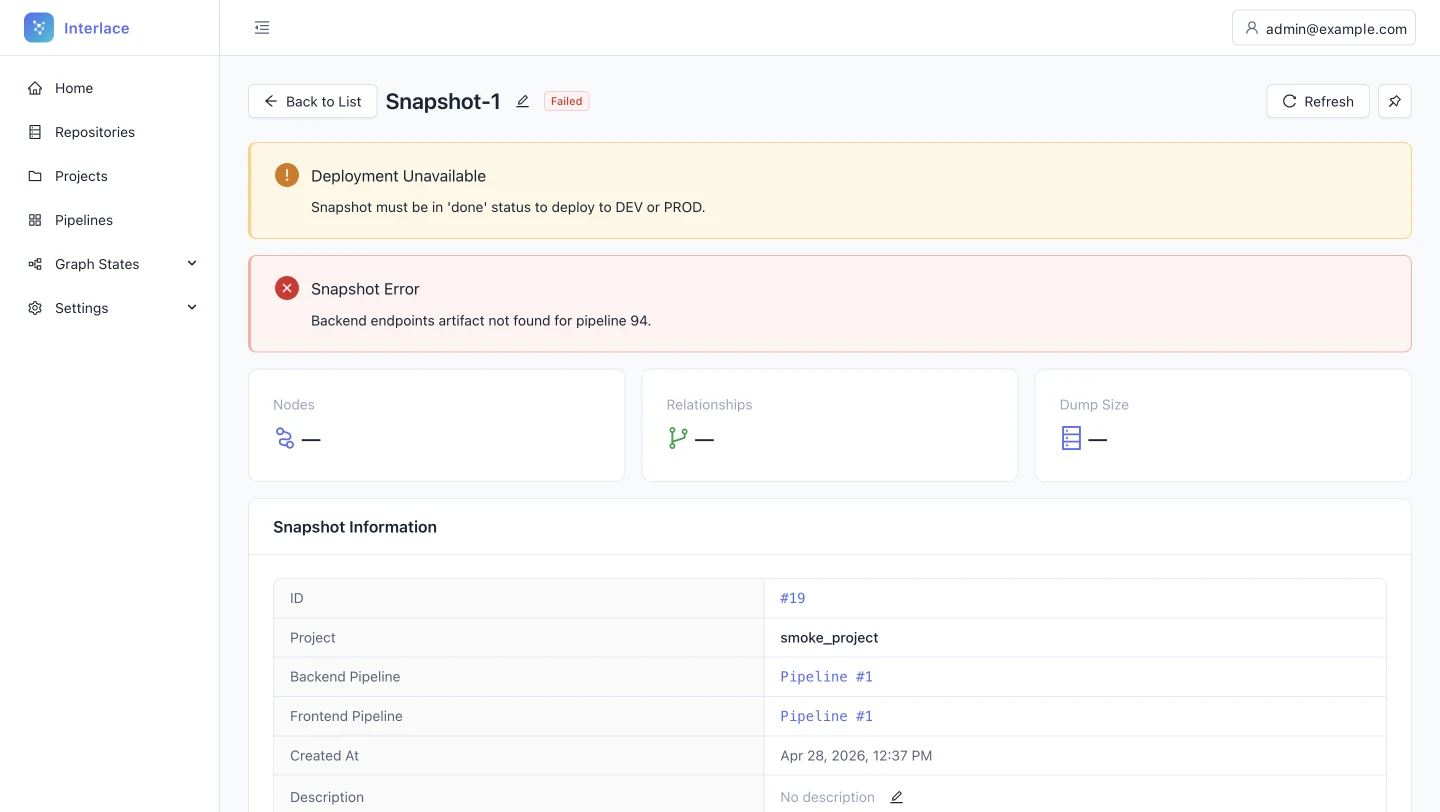
-
A failed snapshot shows two alerts and no way forward
Problem
A yellow “Deployment unavailable” warning and a red “Snapshot error” appear together. The first is only a symptom of the second, and neither suggests a fix. The admin sees the problem twice and the solution never.
Fix
Show the root cause alone, or combine the two (“Deployment unavailable because the snapshot failed”). Pair it with actions such as View pipeline logs or Rerun backend parser.
Help users recognise, diagnose and recover from errors; aesthetic and minimalist design
See it fixed in the redesign: step 4, Snapshot
Connecting the assistant
MCP access
Open full size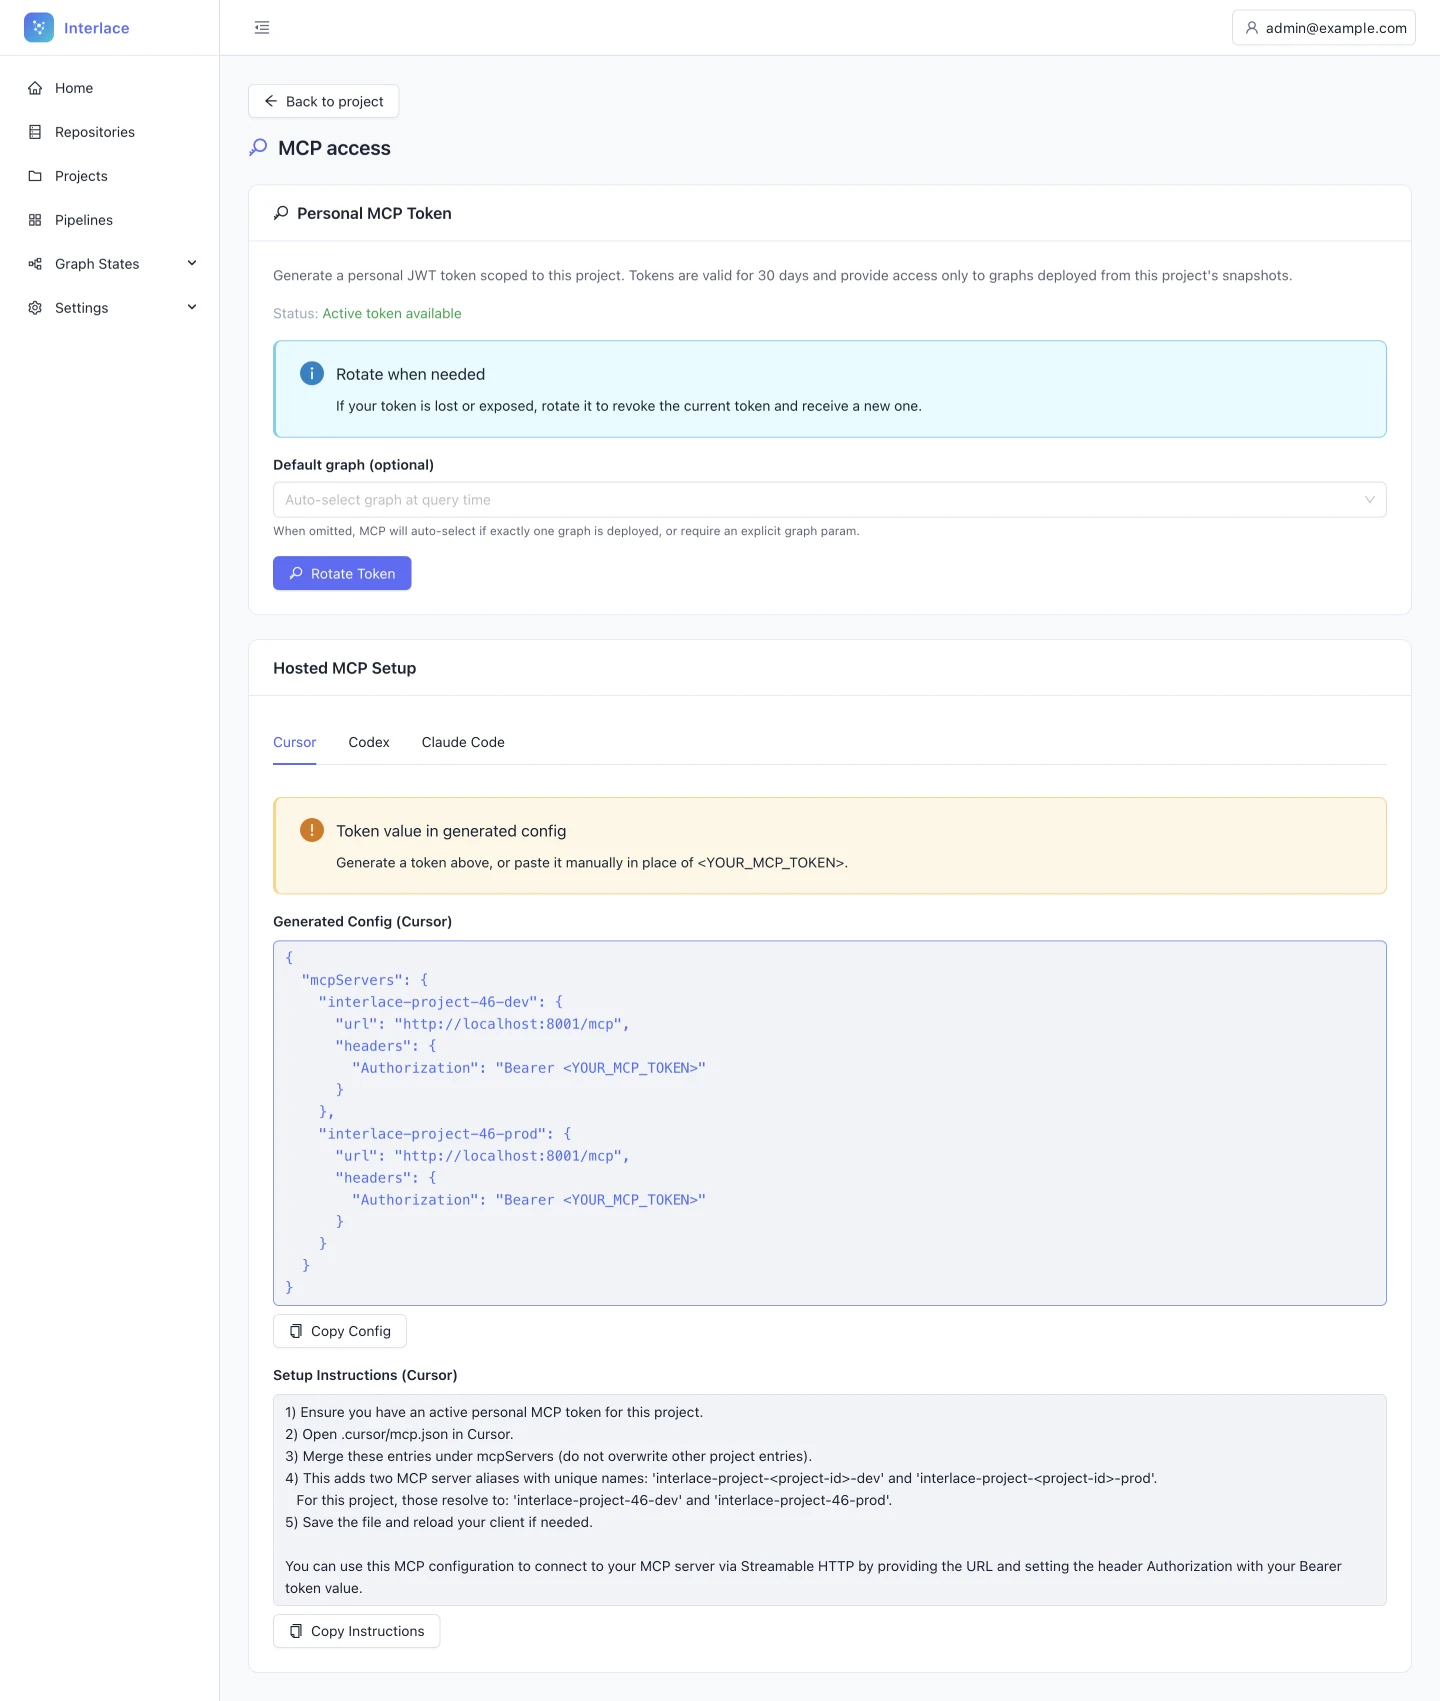
-
MCP setup is a wall of text with a manual JSON merge
Problem
The setup instructions are a wall of text whose third step asks the admin to merge entries under mcpServers without overwriting others, and a separate Copy instructions button adds a second, confusing copy action. Hand-merging JSON invites missing commas and brackets, and either one breaks the IDE connection at the very last step.
Fix
Turn the instructions into a visual stepper, give each step its own copy action, and remove Copy instructions.
Help and documentation; error prevention
See it fixed in the redesign: step 6, MCP access -
The default-graph control sits in the wrong group
Problem
Default graph (optional) sits just above Rotate token, so it reads as a token setting. It actually changes the endpoints in the setup config below, and controls read as belonging to whatever they are grouped with.
Fix
Move it next to the setup tabs, beside the config it changes.
Match between system and the real world
See it fixed in the redesign: step 6, MCP access
Original captures with test data. Browser chrome is removed and the test account email is replaced. The finding text is edited for this page from the original audit.
05 / From findings to a plan
Triage became a sequence.
The 19 findings the team could act on first were grouped into six phases: correctness fixes before any workflow change, then the core admin path, then the end of the path, then the one additive feature, then testing and hand-off. Each phase ships on its own, and the order follows the constraints above, not the severity alone. The project-scoped navigation described in the next chapter is the item sequenced after the team's own migration.
- 19 of 29findings scheduled explicitly, including every Critical and High item on the admin path
- 6phases, each shippable on its own
- 1phase in progress before any workflow change: correctness first
How the order was decided
An impact-and-effort matrix, then two constraints from the team.
- High impact, low effort Fix first Phase 1. Correctness and compliance: contrast, false affordances, the active nav state. Ships without touching the workflow.
- High impact, high effort Plan in sequence Phases 2 and 3. Workflow changes along the admin path, in the order the admin meets them.
- Lower impact, low effort Not scheduled yet 9 Medium findings: real friction with a workaround, on secondary paths. Addressed before the product scales.
- Net new, high effort Validate first Phase 4, the summary ribbon. Nothing is broken; a new feature is a hypothesis to test before it is built.
- Score. Every finding got two scores: user impact and implementation effort. Impact set the label, Critical to Additive, from the definitions in the previous chapter. Effort ranged from a CSS state change to a structural one.
- Place. Impact against effort gives the order. High impact at low effort ships first; high impact at high effort follows in workflow order; net-new capability is tested before it is built.
- Then let the constraints override. Two rules from the team: nothing structural in the navigation until snapshots and graphs have moved into project scope, and every phase ships on its own. That is why one High finding, the project-scoped navigation, sits outside the six phases, and why testing follows phases 1 to 3 rather than the whole plan.
-
Phase 1: Critical fixes: grid views and navigation Correctness and compliance issues. Lowest effort, highest impact. Scoped to the grid views and navigation areas. NowStart here
- Fix WCAG contrast on table headers Darken column header text to at least 4.5:1 against the background. Convert the all-caps header labels (NAME, STATUS, ACTIONS) to sentence case to align with the rest of the design system. Applies to the Projects, Pipelines, Repositories and Snapshots grids. All 4 grids
- Fix false affordances: make IDs real links Pipeline IDs (#7, #6) and project IDs are styled in primary blue but are static. Make them links to the detail view. If they must stay static, set them in the body text colour to remove the link expectation. Pipelines, Projects
- Fix the active nav state: Projects stays highlighted On every project sub-page (Pipelines, Snapshots, MCP access, Repositories, Settings) the Projects item stays active. Users should always know they are scoped within a project. A CSS state fix, and one of the quickest wins in the audit. All project sub-pages
- Move the sidebar toggle into the sidebar The collapse control lives in the global header, away from the panel it controls. Move it into the sidebar: a small chevron at the top of the panel, or a collapse button at the foot of the nav list. Global sidebar
- Standardise row actions to a kebab menu Replace the current action patterns (stacked buttons in Snapshots, text links in Pipelines) with one kebab menu for secondary actions. One standalone icon alongside it is acceptable for a destructive action, but only if applied consistently across all tables. All 4 grids
- Unify filter inputs and fix disabled states Standardise every filter input: descriptive icons on the left, action and dropdown icons on the right, one border weight, radius and padding. Raise the contrast of the disabled Branch and Linked to project dropdowns so they are clearly visible, and explain with a tooltip why a field is inactive. All 4 grids
- Deep-link to GitHub and GitLab token generation Replace the helper text about token scopes with a direct link to the provider's token page. It saves the user 5 to 7 clicks and respects their technical expertise without adding educational friction. Repository, Add repository
-
Phase 2: Project flow: dashboard, upload and pipeline Fixes to the core admin workflow, from project creation to running the first pipeline. NextAfter phase 1
- Derive the folder name from the uploaded ZIP Remove the up-front folder name requirement. When a ZIP is selected, fill the folder name from the file name and let the user edit it before confirming. This removes the silent failure where a file appears uploaded but is never processed because the field was blank. Project, Settings
- Add rename and duplicate detection Add an inline Rename action in the code structure table. On upload, detect whether the folder name already exists and offer to merge, to upload as a new version with _v2 appended, or to cancel. Never merge silently. Project, Settings
- Post-upload action: Run pipeline now After a successful upload, show a persistent notice with the next step in place: the code is uploaded, run the pipeline. This bridges the gap in the happy path, so users no longer have to navigate to Pipelines and work out what to do next. Project, Settings
- A next-step area on the project dashboard Add a contextual next-step area at the top of the project dashboard that follows the project's state: no repositories, upload code; pipeline complete with no snapshot, create a snapshot; snapshot ready, deploy the graph; graph deployed, set up MCP. It guides the user through the five-step path without memorising the workflow. Project dashboard
- Enrich dashboard cards with live status Move beyond passive counts. Pipelines: the last run's status, with Rerun on failure. Snapshots: the deployment status (PROD, DEV or not deployed). MCP access: whether a token is active and when it rotates. Repositories: the source count and last sync. Project dashboard
- Restructure the Projects list columns Replace database-centric columns with operational ones. Remove Created at, rename Updated at to Last activity, and add Repositories, Last pipeline (Done, Failed or Running) and Deployment (DEV, PROD or none). The list becomes an operational dashboard. Projects list
- Surface pipeline phase recovery actions When a phase fails, show Rerun directly on that row rather than inside a dropdown. Improve the hierarchy between the overall progress bar and the phases below it, so a failed phase is actionable at once. Project, Pipeline detail
-
Phase 3: Project flow: snapshot and MCP access Fixes to the end of the workflow: snapshot deployment, error recovery and MCP token setup. NextAfter phase 1
- Fix the colour semantics on the snapshot page Change Deploy to PROD from solid red to the primary colour, and make Deploy to DEV the secondary action. Reserve red for Delete snapshot. Protect PROD with friction instead of colour: a confirmation that asks the admin to type PROD. Keep Delete visually isolated, or move it into an overflow menu. Project, Snapshot
- Improve error recovery in the failed snapshot state Suppress the secondary Deployment unavailable warning when a snapshot error is present, or combine the two into one message. Pair the error with a recovery action: View pipeline logs or Rerun backend parser. Users must never be left stranded after a failure. Project, Snapshot (failed)
- MCP setup: replace dense instructions with a visual stepper Turn the instruction block into a three-step stepper with a code block and a copy button per step. Remove Copy instructions, which confuses more than it helps. Step 3 must not ask users to merge JSON by hand; provide a ready-to-paste snippet instead. Project, MCP access
- Fix the Default graph control placement Move the Default graph select so it sits beside the setup config it actually changes. Where it is now, it reads as a parameter of token generation. Controls sit next to what they control. Project, MCP access
-
Phase 4: Additive: summary metrics A new feature, not a fix. Validate with users before building. Scoped and testable on its own. LaterValidate first
- Summary ribbon: metric cards above every grid
- Add a row of three or four small metric cards above each grid's filter bar.
- Projects: total, active pipelines, failed pipelines.
- Pipelines: runs in 30 days, success rate, running now, average duration.
- Snapshots: total, storage used, active deployments.
- Repositories: connected sources, last synced, sync errors.
- Selecting a card filters the table below it.
- Summary ribbon: metric cards above every grid
-
Phase 5: Usability testing with real users Moderated sessions against an HTML prototype. Covers the phase 1 to 3 changes and the additive ribbon. TestingValidation
- 5.1 Participants Five to eight developers or business analysts matching Interlace's two roles: the admin with full access and the user who only consumes MCP. Recruit from existing users where possible. Recruit
- 5.2 Scenario tasks
- You have just joined as admin. Upload a codebase and get it ready for your team to use in Cursor.
- Find which pipeline failed last and rerun only the broken phase.
- A snapshot just failed. What do you do?
- Set up MCP in Cursor using this project.
- Compare this week's pipeline runs. How many succeeded?
- 5.3 Metrics to collect
- Task success rate.
- Time on task.
- Errors per task.
- A SUS score from a post-session survey.
- Think-aloud notes: moments of confusion and the vocabulary people use.
-
Phase 6: Final polish, documentation and hand-off Fold the test findings back in, finish the design hand-off, and document the improvement cycle. FinalHand-off
- 6.1 Incorporate testing findings Apply the corrections surfaced in the sessions, with a final polish pass, and tag the changes as updated after testing for the developer hand-off. Design files
- 6.2 Developer hand-off Mark the updated screens as ready for development, export the design tokens, and annotate spacing, states and interaction notes, especially for the kebab menu, the disabled states and the MCP stepper. Hand-off
- 6.3 Process documentation Document the cycle end to end: problem definition, the findings with screenshots, the design decisions with rationale and alternatives, before-and-after comparisons, the testing results, and the outcome and next steps. Deliverable
Why this order
- Phase 1 before phase 2: correctness before flow
- The grid-view fixes (contrast, false affordances, the active nav state) are compliance and correctness issues that can ship independently of any workflow redesign. Starting there delivers fast, demonstrable wins and keeps the early phases from creeping in scope.
- The summary ribbon is additive, and labelled as such
- The summary ribbon is a net-new feature, not a fix to something broken. It sits in phase 4 so it can be prototyped and tested on its own without blocking the correctness work. Phases 1 to 3 are not deprioritised for it.
- Structural navigation changes are deferred
- The team confirmed it is moving snapshots and graphs from global scope into project scope. Any navigation architecture redesign waits until that change has shipped, to avoid designing twice. The active nav state and the sidebar toggle are safe to fix now: they change visual state, not structure.
- An HTML prototype for interaction-level changes
- The kebab menu, clickable IDs and the MCP stepper are interaction-level changes that static screens cannot demonstrate. They are built as an HTML prototype for the usability sessions and shared by link for review.
06 / The solution
One guided path.
The system carries the sequence.
Interlace's admin app stops being a set of equal sections and becomes one state-aware path. The project is the unit of work, the project home is its control centre, and every completed step hands the admin the next one. The system, not the admin, remembers what comes next.
The path, before and after
The same five steps. What changes is who carries the hand-off between them.
Before Manual hand-offs. The admin has to notice, navigate and remember.
- 1
Upload code
The folder has to be named first. Leave it blank and it looks like success.
Manual hand-off - 2
Run pipeline
Nothing prompts the run, and progress can sit still for minutes.
Manual hand-off - 3
Create snapshot
The admin has to notice completion and find the snapshot screen alone.
Manual hand-off - 4
Deploy
Deploying to PROD looks more dangerous than deleting.
Manual hand-off - 5
Connect MCP
Setup asks for a hand-merged JSON config.
After System-led hand-offs. Each completion offers the next action in place.
- 1
Upload code
The folder name comes from the file. A duplicate asks before merging.
Upload success offers the run - 2
Run pipeline
A named, scoped run with a live phase, elapsed time and inline rerun.
Run completion offers the snapshot - 3
Create snapshot
Facts about the graph, and one root-cause error with a fix if it fails.
Snapshot success offers deployment - 4
Deploy
DEV secondary, PROD primary and typed to confirm. Red only for delete.
Deployment offers MCP setup - 5
Connect MCP
A token, a complete config for the assistant, and nothing to merge by hand.
The project home shows the current step throughout
Where things live
The structural change behind the path: inside a project, the navigation belongs to the project.
- Global lists stay global
- Home, Repositories, Pipelines, Graph States, Settings: every object across every project, for the admin who runs the whole tenant.
- Inside a project, the sidebar is the project's
- Projects stays active and opens the project's own sections: Overview, Code, Pipelines, Snapshots, Deployments, MCP access. The admin always knows which list they are looking at.
- Sequenced after the migration
- The team was moving snapshots and graphs into project scope. This structure is the target that migration makes possible; the roadmap says when.
Four decisions behind the screens
Each decision groups several findings into a single rule, and names its trade-off.
-
Guide the sequence instead of exposing the system.
- Signal
-
The workflow is strictly sequential, but the interface gives every section equal weight and stops after each step.
From the audit
Home cards carry no data, Nothing says what to do first, After upload, the next step is manual, The flow stalls after a successful run.
- Decision
-
The project home always shows one next step, and every completion hands the admin the following action in place: upload → run → snapshot → deploy → connect.
- Trade-off
A guided path adds a persistent element to the dashboard. For experienced admins it has to stay compact and never block direct navigation. Starting pipelines automatically was rejected because every run costs compute; the redesign offers the run instead of starting it.
-
Prevent silent failures at the first step.
- Signal
-
A blank folder name looks like a successful upload, and duplicate names merge without warning.
From the audit
Blank folder name fakes an upload.
Uploads merge silently, no rename.
Replacing code looks routine.
- Decision
-
Take the folder name from the file, and ask before merging or replacing. The safe default is a new version, _v2.
- Trade-off
One extra dialog for the rare duplicate, in exchange for removing a mandatory field from every upload.
- Where to see it
-
Friction, not colour, for risky actions.
- Signal
-
Deploy to PROD is solid red, and Delete snapshot is a red outline. The colour of danger marks a normal step, while real loss looks secondary.
From the audit
Deploy to PROD looks like deleting.
- Decision
-
Deployment uses the primary action colour, with DEV as the secondary action and PROD as the primary. PROD asks the admin to type PROD. Delete is the only red action and moves into an overflow menu.
- Trade-off
Deploying to PROD takes one more deliberate action. That is the point: the confirmation is proportional to the consequence.
- Where to see it
-
Show status where the decision is made.
- Signal
-
Cards count things, tables list database fields, progress can look frozen, and a failed snapshot shows two alerts with no way forward.
From the audit
Failed snapshot: two alerts, no way out.
Projects table lists database fields, Cards count things, not status, A running pipeline can look frozen.
Grids have no health summary.
- Decision
-
Each surface answers “is it working, and what do I do next?”:
- Status on cards and table rows.
- A live indicator and sub-status while a pipeline runs.
- One root-cause error with a fix action.
- Trade-off
More information per card. Hierarchy has to keep the status line dominant and the counts secondary.
What is deliberately not automated
Pipelines are never started without a click, because every run costs compute. The path offers the next action in place; it does not take it. The same holds for deployment: the system prepares the step, the admin commits to it.
The measure
Time from an empty project to the first MCP query, and the number of silent failures along the way. If the path works, both fall. That is what the last chapter says should be instrumented.
07 / The redesigned path
Six steps.
Each one hands you the next.
Each step shows the audited screen and the redesigned one together. The redesign is live: the primary action on each screen hands you the next step, and a switch above each frame shows its other state. Every step names what changed and links to the finding it answers.
Step 1 of 6Project home
What changed
- A next-step banner tells a new project what to do first
- Cards report status instead of counting things
- Every card carries data, not just a link
- The title carries the project's ID, owner and last activity
- Projects stays active inside a project, with the toggle in the sidebar
- Back moves into the header, so the title has its own line
Dashboard cards count things instead of reporting status
The dashboard cards say “2 pipelines” or “0 snapshots”, but not whether the latest run succeeded or whether anything is deployed. The numbers are true but not useful: the admin still has to open each section.
Fix
- Pipelines: the latest run's status and progress, with Rerun on failure.
- Snapshots: the latest date and deployment.
- MCP access: token state and last rotation.
The project page hides its own context
The project header shows only a folder icon and the name. The ID, description, owner and dates live in Settings, so anyone opening the project has to go elsewhere to learn what it is.
Fix
Use the empty space under the title for a meta line: project ID, description, owner and last update.
Open in the auditNothing tells a new project what to do first
Six cards carry equal weight, although the workflow is strictly sequential: upload code, run a pipeline, create a snapshot, deploy, use MCP. A new admin has to discover the order by trial and error.
Fix
Add a next-step area whose primary action follows the project's state. For example, “Upload code and start analysis” when there are no pipelines, and “Create snapshot” when a run has just finished.
Open in the auditProjectsOrders platform
Orders platform
Order capture, fulfilment and invoicing services for the web shop.No description.
- Upload code Done Uploaded today, 08:51
- Run pipeline Done Run finished 09:12
- Create snapshot Current
- Deploy Not started
- Connect MCP Not started
Code
No code yet
Upload a ZIP or connect a repository
1 repository, 1,284 files
orders-api, uploaded today, 08:51
Pipelines
No runs yet
Starts after code upload
Last run #7: Done
18 min, finished 09:12
Snapshots
None yet
Created from a finished pipeline
orders-api graph, 12 May
92 nodes, 209 relationships
Deployments
Nothing deployed
DEV: none. PROD: none
Deployed to PROD
orders-api graph, 12 May, since today, 10:20
MCP access
No active token
Available once a snapshot is deployed
Token active until 11 Jun
Scope: this project's deployed graphs
Settings
Owner: admin@example.com
Routing: smart routing
Recent activity
- 10:32MCP token created
- 10:20orders-api graph, 12 May deployed to PROD
- 09:58Snapshot created from pipeline #7
- 09:12Pipeline #7 finished in 18 min
- 08:54Pipeline #7 started by admin@example.com
- 08:51orders-api.zip uploaded by admin@example.com
- 08:47Project created by admin@example.com
Step 2 of 6Add code
What changed
- The folder name comes from the file, and stays editable
- A duplicate name asks before merging or replacing, and folders can be renamed
- Replacing code carries a warning about pipelines and graphs
- The token helper is a link to the provider's token page
A blank folder name fakes a successful upload
Uploading a ZIP requires a folder name first. Left blank, the interface behaves as if the upload succeeded, but nothing is processed. A silent failure at the first step breaks everything after it, and the admin finds out much later.
Fix
Remove the up-front field and derive the folder name from the ZIP file name. Keep it editable.
Open in the auditUploads merge silently, and folders can't be renamed
Uploading to an existing folder name merges the two without warning, and a folder can't be renamed once it exists. Silent merges risk corrupting the code the graph is built from.
Fix
On a duplicate name, ask whether to merge or to upload a new version (for example backend_v2). Add an inline Rename action to the code structure table.
Open in the auditAfter upload, the next step is manual
Once code is uploaded, the admin has to navigate to Pipelines and start the analysis by hand. The flow stops at the moment the admin is most ready to continue.
Fix
On success, offer the next step in place: “Code uploaded. Run pipeline now.”
Open in the auditProjectsOrders platformCode
Add code
Interlace parses the code you add here. Upload a ZIP or connect a repository.
orders-api uploaded
1,284 files, both parsers. Run the pipeline to build the graph.
A folder called orders-api already exists in this project
Uploading a new version replaces the existing codebase. Run a new pipeline afterwards to update the graph.
Drop a ZIP here or choose a file
Up to 5 GB compressed and 50,000 files. Binaries are excluded from parsing.
Taken from the file name. You can rename it at any time.
Code in this project
No code yet. Upload a ZIP or connect a repository above.
| Folder | Parsers | Files | Uploaded by | Uploaded at | Actions |
|---|---|---|---|---|---|
| orders-api | Both | 1,284 | admin@example.com | today, 08:51 | |
Step 3 of 6Run pipeline
What changed
- Upload success offers the run in place
- The run is named and scoped before it starts
- Progress shows the phase, the file being analysed and the time left
- A failed phase shows Rerun on its own row
Recovery actions hide in per-phase dropdowns
Rerun phase sits inside a small Actions menu on every phase, and the overall progress and the phase list carry the same visual weight. The one action a failed phase needs is the hardest to find.
Fix
When a phase fails, show Rerun directly on that row.
Open in the auditProjectsOrders platformPipelines
Run the project pipeline
Parses everything in Orders platform. You can leave this page while it runs.
- Scope
- 1 repository, orders-api, 1,284 files
- Routing
- Smart routing
- Compute
- Uses the shared compute budget
Pipeline #7
Started 08:54 by admin@example.com. Smart routing, both parsers.Started 08:54, finished 09:12. Smart routing, both parsers.
Phase 4 of 9: endpoint discovery
38% done, 07:41 elapsed, about 10 min leftstopped
Analysing file 412 of 1,284
Phase 4 failed. Fix the cause or rerun the phase; the earlier phases are kept.
Next: create a snapshot of the graph
The graph is built. A snapshot freezes it so it can be deployed.
- 1Project structure discovery Endpoint parser timed out on services/checkout Done, 0:42
- 2Smart file sampling Endpoint parser timed out on services/checkout Done, 1:10
- 3Technology detection Endpoint parser timed out on services/checkout Done, 0:58
- 4Endpoint discovery Endpoint parser timed out on services/checkout In progress
- 5Entity discovery Endpoint parser timed out on services/checkout Pending
- 6Endpoint-entity mapping Endpoint parser timed out on services/checkout Pending
- 7Service grouping Endpoint parser timed out on services/checkout Pending
- 8User flow reconstruction Endpoint parser timed out on services/checkout Pending
- 9Graph files generation Endpoint parser timed out on services/checkout Pending
Step 4 of 6Snapshot
What changed
- A finished run offers Create snapshot in place
- A failed snapshot shows one root cause with a fix
A failed snapshot shows two alerts and no way forward
A yellow “Deployment unavailable” warning and a red “Snapshot error” appear together. The first is only a symptom of the second, and neither suggests a fix. The admin sees the problem twice and the solution never.
Fix
Show the root cause alone, or combine the two (“Deployment unavailable because the snapshot failed”). Pair it with actions such as View pipeline logs or Rerun backend parser.
Open in the auditProjectsOrders platformSnapshots
orders-api graph, 12 May
Snapshot of Orders platform from pipeline #7.
Freezing 92 nodes and 209 relationships from pipeline #7.
In progress
Snapshot failed
Backend endpoints artifact not found for pipeline #7. The endpoint discovery phase produced no output.
Deployment becomes available once a snapshot succeeds.
Next: deploy it so assistants can query it
Deploy to DEV to try it, or to PROD for every connected assistant.
- Nodes
- 92
- Relationships
- 209
- Dump size
- 73 KB
- Backend pipeline
- #7
- Frontend pipeline
- #7
- Created
- 12 May 2026, 09:58
- Backend pipeline
- #7
- Frontend pipeline
- #7
- Attempted
- 12 May 2026, 09:58
What's in the graph
- 12 services
- 38 endpoints
- 21 entities
- 9 user flows
Deployments
- DEVNot deployed0 of 5 slots used by this snapshot
- PRODNot deployed0 of 5 slots used by this snapshot
Step 5 of 6Deploy
What changed
- Deployment uses the primary colour, with DEV as the secondary action
- PROD is protected by typing its name, not by colour
- Delete is the only red action, inside the overflow menu
Deploying to PROD looks more dangerous than deleting
Deploy to PROD is a solid red button, and below it Delete snapshot is an outlined red button. Red should mean irreversible loss. Here it marks a normal workflow step, and the real danger reads as secondary.
Fix
- Use the primary colour for deployment, with DEV as secondary and PROD as primary.
- Protect PROD with friction instead of colour: a confirmation that asks the admin to type PROD.
- Keep Delete the only red action, or move it into an overflow menu.
ProjectsOrders platformSnapshots
orders-api graph, 12 May
Snapshot of Orders platform from pipeline #7.
Next: connect your assistant
Deployed to PROD. Create a token and add the graph to Cursor or Claude Code.
Deployments
A slot serves one snapshot to the assistants connected to it. DEV is for trying a graph; PROD is what every connected assistant answers from.
DEV
1 of 5 slots used2 of 5 slots used
This snapshot is not deployed to DEV.
Deployed orders-api graph, 12 May, since today, 10:05
PROD
0 of 5 slots used1 of 5 slots used
Nothing deployed. Connected assistants have no graph to answer from.
Deployed orders-api graph, 12 May, since today, 10:20
Step 6 of 6MCP access
What changed
- A complete config replaces the hand-merged JSON
- Copy instructions is gone; each block has its own copy action
- The default graph sits next to the config it changes
MCP setup is a wall of text with a manual JSON merge
The setup instructions are a wall of text whose third step asks the admin to merge entries under mcpServers without overwriting others, and a separate Copy instructions button adds a second, confusing copy action. Hand-merging JSON invites missing commas and brackets, and either one breaks the IDE connection at the very last step.
Fix
Turn the instructions into a visual stepper, give each step its own copy action, and remove Copy instructions.
Open in the auditThe default-graph control sits in the wrong group
Default graph (optional) sits just above Rotate token, so it reads as a token setting. It actually changes the endpoints in the setup config below, and controls read as belonging to whatever they are grouped with.
Fix
Move it next to the setup tabs, beside the config it changes.
Open in the auditProjectsOrders platformMCP access
MCP access
Connect an AI assistant to this project's deployed graphs over MCP.
Token
No token yet
A token lets an assistant query this project's deployed graphs. It expires after 30 days.
Active until 11 Jun 2026
- Scope
- This project's deployed graphs
- Token
- ilc_********3f9a
Set up your assistant
Changes the endpoint in the config below.
Paste this inside mcpServers.
{
  "mcpServers": {
    "interlace-orders-platform": {
      "url": "https://interlace.example.com/mcp/projects/90/prod",
      "headers": {
        "Authorization": "Bearer ilc_********3f9a"
      }
    }
  }
}
"interlace-orders-platform": {
"url": "https://interlace.example.com/mcp/projects/90/prod",
"headers": {
"Authorization": "Bearer ilc_********3f9a"
}
}{
"mcpServers": {
"interlace-orders-platform": {
  "url": "https://interlace.example.com/mcp/projects/90",
  "headers": {
    "Authorization": "Bearer ilc_********3f9a"
  }
}
}
}"interlace-orders-platform": {
"url": "https://interlace.example.com/mcp/projects/90",
"headers": {
"Authorization": "Bearer ilc_********3f9a"
}
}claude mcp add --transport http interlace-orders-platform https://interlace.example.com/mcp/projects/90/prod --header "Authorization: Bearer ilc_********3f9a"claude mcp add --transport http interlace-orders-platform https://interlace.example.com/mcp/projects/90 --header "Authorization: Bearer ilc_********3f9a"Try it
Ask your assistant: “Using the Interlace graph, explain how checkout works.”
Resets every screen to an empty project and scrolls to step 1.
08 / System rules
Four rules
the whole interface follows.
Some findings aren't a step in the path. They are patterns that repeat on every screen. Each rule is shown with its Before and After specimens together.
Rule 1A table tells you what needs attention.
Headers use sentence case and at least 4.5:1 contrast. The primary identifier is the only link. Row actions follow one pattern: a menu for secondary actions, plus at most one icon for a critical action. Operational columns come before administrative ones. A summary ribbon above the table answers the first question before the admin scans the rows.
The summary ribbon is marked as a hypothesis to validate.
Fixes
Table headers fail contrast, Blue IDs look like links, do nothing.
Row actions differ in every table, Every table opens details differently.
Projects table lists database fields.
Grids have no health summary.
Rule 2Navigation always says where you are.
Projects stays active on every page inside a project. The sidebar toggle lives in the sidebar. Back sits in the header, so the page title stands alone.
Fixes
Navigation forgets where you are.
Sidebar toggle sits outside the sidebar.
Back and the title share one row.
Rule 3Inputs look alike and explain themselves.
Every field shares one border, radius, type style and padding. Descriptive icons go on the left, action icons on the right. A disabled field says why, for example “Branch isn't available for ZIP uploads.” Primary buttons stay disabled until there is something to act on, and use precise verbs, such as “Upload and replace”.
Fixes
Filter inputs disagree, disabled fields vanish, “Edit” only replaces, and Save is always on, No record of what gets overwritten.
Rule 4Red means loss.
Red is reserved for destructive, irreversible actions and critical errors. High-stakes but constructive actions, such as deploying to production, use the primary colour and are protected by friction.
Fixes
Deploy to PROD looks like deleting.
09 / The outcome
A review that became
the roadmap.
The audit did more than list problems. Scoring every finding on user impact and implementation effort turned 29 observations into a sequence the team could plan against: correctness fixes first, then the admin path, then the additive work, each phase shippable on its own, and the structural navigation change timed to the team's own migration.
That sequence changed the strategy. Instead of polishing screens one at a time, the admin application is rebuilt as one guided path: the project home carries the current step, every completion offers the next action in place, and four system rules keep tables, navigation, inputs and colour consistent across every screen. Phase 1 is in progress.
What carries over to the next review: score before you sketch. The priority matrix did more for the team than any single screen, because it said what to ship first and why.
- 29findings on 16 screens, each with a fix and a place in the redesign
- 6phases, sequenced by impact, effort and the team's constraints
- 1guided path of six screens and four system rules, in place of five manual hand-offs
The home dashboard says almost nothing
Home shows a welcome banner and three cards that link to Projects, Pipelines and Graph, and none of them carries data. The first screen after sign-in can't tell the admin whether anything needs attention.
Fix
Turn the cards into telemetry: counts of projects, pipelines and graphs, plus status badges (Done, Failed, Pending) for the most recent pipelines.
Visibility of system status
Open in the auditThe projects table lists database fields, not project health
The projects table has six columns: ID, Name, Description, Status, Created at and Updated at. Four are administrative metadata, and nothing shows pipelines, graphs or code. To learn whether a pipeline failed or a graph is live, the admin has to open each project.
Fix
Add operational columns: linked repositories, last pipeline status, and deployment (DEV, PROD or none). Remove Created at and rename Updated at to Last activity, which also avoids horizontal scrolling.
Visibility of system status; recognition rather than recall
Open in the auditThe project page hides its own context
The project header shows only a folder icon and the name. The ID, description, owner and dates live in Settings, so anyone opening the project has to go elsewhere to learn what it is.
Fix
Use the empty space under the title for a meta line: project ID, description, owner and last update.
Recognition rather than recall
Open in the auditDashboard cards count things instead of reporting status
The dashboard cards say “2 pipelines” or “0 snapshots”, but not whether the latest run succeeded or whether anything is deployed. The numbers are true but not useful: the admin still has to open each section.
Fix
- Pipelines: the latest run's status and progress, with Rerun on failure.
- Snapshots: the latest date and deployment.
- MCP access: token state and last rotation.
Visibility of system status
Open in the auditNothing tells a new project what to do first
Six cards carry equal weight, although the workflow is strictly sequential: upload code, run a pipeline, create a snapshot, deploy, use MCP. A new admin has to discover the order by trial and error.
Fix
Add a next-step area whose primary action follows the project's state. For example, “Upload code and start analysis” when there are no pipelines, and “Create snapshot” when a run has just finished.
Help and documentation; error prevention
Open in the auditA blank folder name fakes a successful upload
Uploading a ZIP requires a folder name first. Left blank, the interface behaves as if the upload succeeded, but nothing is processed. A silent failure at the first step breaks everything after it, and the admin finds out much later.
Fix
Remove the up-front field and derive the folder name from the ZIP file name. Keep it editable.
Error prevention; match between system and the real world
Open in the auditUploads merge silently, and folders can't be renamed
Uploading to an existing folder name merges the two without warning, and a folder can't be renamed once it exists. Silent merges risk corrupting the code the graph is built from.
Fix
On a duplicate name, ask whether to merge or to upload a new version (for example backend_v2). Add an inline Rename action to the code structure table.
User control and freedom
Open in the auditAfter upload, the next step is manual
Once code is uploaded, the admin has to navigate to Pipelines and start the analysis by hand. The flow stops at the moment the admin is most ready to continue.
Fix
On success, offer the next step in place: “Code uploaded. Run pipeline now.”
Flexibility and efficiency of use
Open in the audit“Run Pipeline” doesn't say what it runs
On the project's Repositories page, Run Pipeline sits next to Link repository. It could run for the listed repositories, for the whole project, or simply open Pipelines. Ambiguity is expensive when a run takes around 20 minutes.
Fix
Name it for what it does. If it navigates, use “Go to pipelines”. If it starts a project-wide run, use “Run project pipeline” and put it behind a confirmation.
Match between system and the real world; error prevention
Open in the auditA running pipeline can look frozen
The progress bar can stay still for minutes, with no movement or detail to show that work continues. Admins may assume a silent failure and cancel a healthy run.
Fix
- An indeterminate indicator on the active phase.
- A sub-status such as “Analysing file 45 of 300”.
- The elapsed time.
Visibility of system status
Open in the auditRecovery actions hide in per-phase dropdowns
Rerun phase sits inside a small Actions menu on every phase, and the overall progress and the phase list carry the same visual weight. The one action a failed phase needs is the hardest to find.
Fix
When a phase fails, show Rerun directly on that row.
Recognition rather than recall; aesthetic and minimalist design
Open in the auditThe workflow stalls after a successful run
When a pipeline finishes, nothing leads on. The admin has to notice it is done, go to Graph States and start a snapshot, so the step that turns a run into something usable depends on memory.
Fix
On completion, show a persistent notice with Create snapshot. Put the same action on the completed pipeline's page.
Flexibility and efficiency of use; recognition rather than recall
Open in the auditDeploying to PROD looks more dangerous than deleting
Deploy to PROD is a solid red button, and below it Delete snapshot is an outlined red button. Red should mean irreversible loss. Here it marks a normal workflow step, and the real danger reads as secondary.
Fix
- Use the primary colour for deployment, with DEV as secondary and PROD as primary.
- Protect PROD with friction instead of colour: a confirmation that asks the admin to type PROD.
- Keep Delete the only red action, or move it into an overflow menu.
Consistency and standards; error prevention
Open in the auditA failed snapshot shows two alerts and no way forward
A yellow “Deployment unavailable” warning and a red “Snapshot error” appear together. The first is only a symptom of the second, and neither suggests a fix. The admin sees the problem twice and the solution never.
Fix
Show the root cause alone, or combine the two (“Deployment unavailable because the snapshot failed”). Pair it with actions such as View pipeline logs or Rerun backend parser.
Help users recognise, diagnose and recover from errors; aesthetic and minimalist design
Open in the auditMCP setup is a wall of text with a manual JSON merge
The setup instructions are a wall of text whose third step asks the admin to merge entries under mcpServers without overwriting others, and a separate Copy instructions button adds a second, confusing copy action. Hand-merging JSON invites missing commas and brackets, and either one breaks the IDE connection at the very last step.
Fix
Turn the instructions into a visual stepper, give each step its own copy action, and remove Copy instructions.
Help and documentation; error prevention
Open in the auditThe default-graph control sits in the wrong group
Default graph (optional) sits just above Rotate token, so it reads as a token setting. It actually changes the endpoints in the setup config below, and controls read as belonging to whatever they are grouped with.
Fix
Move it next to the setup tabs, beside the config it changes.
Match between system and the real world
Open in the auditThe “Edit” page can only replace a file, and Save is always on
The page is titled “Edit — smoke_project (ZIP)”, but its only capability is uploading a new version, and the primary Save button is active before any file is staged. “Edit” promises a form, and an active Save with nothing to save invites a click that appears to do nothing.
Fix
Title the page Update repository. Keep the primary action disabled until a valid ZIP is staged, then label it Upload and replace.
Match between system and the real world; error prevention
Open in the auditNo record of what is about to be overwritten
The Code status card shows the files count as “—” and leaves out Uploaded at and Uploaded by, both of which Project settings does show. Before replacing a repository, an admin needs to know what is there, who put it there, and when.
Fix
Show the last upload date and author. If parsing hasn't happened yet, say “Pending analysis” instead of showing a dash.
Visibility of system status; recognition rather than recall
Open in the auditReplacing code looks as harmless as a first upload
The upload zone for a new version looks identical to a first upload, although replacing source code affects pipelines, graphs and snapshots. A consequential action gets no more care than a routine one.
Fix
Add an inline warning above the zone: “Uploading a new version replaces the existing codebase. Run a new pipeline to update the graph.”
Help users recognise, diagnose and recover from errors
Open in the auditGetting a Git token means leaving the flow
Linking GitHub or GitLab needs a personal access token. The interface names the scopes, but the admin still has to find the token page in the provider's settings and come back. A technical user doesn't need instructions here, just a shorter route.
Fix
Turn the helper text into a deep link to the provider's token page, for example “Create a token on GitHub”. The audit estimates this saves 5 to 7 clicks.
Flexibility and efficiency of use
Open in the auditEach table handles row actions differently
Snapshots stack a solid View button, a Deploy dropdown and a trash icon. Pipelines mix text links with red icons. Repositories and Projects use a kebab menu. Every table has to be learned separately, and visual weight no longer signals importance.
Fix
Use one global pattern. A kebab menu holds the secondary actions, with at most one standalone icon for a critical action. Apply it the same way in every table.
Consistency and standards
Open in the auditTable headers fail contrast and break the type system
Headers such as NAME, STATUS and ACTIONS use a light grey that appears to fall below WCAG 2.1 AA contrast, and they are set in all caps, which the product uses nowhere else. A contrast failure is a correctness problem, not a style preference.
Fix
Darken the headers to at least 4.5:1 and set them in sentence case (Name, Status, Actions).
Accessibility (WCAG 2.1 AA); consistency and standards
Open in the auditBlue IDs look like links but do nothing
Pipeline IDs (#7, #6) and project IDs are set in the link colour but are not clickable. Blue text in a table reads as a link, so static blue text causes misclicks and erodes trust in every other signal.
Fix
Make the identifier the link to the detail view. If it has to stay static, set it in the body text colour.
Consistency and standards; error prevention
Open in the auditGrids have no summary of system health
Every grid lists rows with a pagination count and nothing above them. Questions like “how many pipelines failed today?” need mental arithmetic or a scan of every row.
Fix
- Projects: total, active pipelines, failed pipelines.
- Pipelines: runs in 30 days, success rate, running now, average duration.
- Snapshots: total, storage used, active deployments.
- Repositories: connected sources, last synced, sync errors.
- A hypothesis to prototype and validate.
Flexibility and efficiency of use
Open in the auditFilter inputs disagree, and disabled fields almost vanish
Search has its icon on the left, the date picker on the right, and the disabled Branch and Linked to project dropdowns are so faint they look like rendering errors. Users with screen glare or low vision may not realise the filters exist.
Fix
- Standardise the inputs: border, radius, type, padding, and icon placement, with descriptive icons on the left and action icons on the right.
- Explain disabled fields with a tooltip, for example “Branch isn't available for ZIP uploads.”
Consistency and standards; aesthetic and minimalist design; accessibility
Open in the auditInside a project, the navigation forgets where you are
On project sub-pages (pipelines, snapshots, MCP access), the Projects item is no longer highlighted. The admin can't tell whether a list is global or scoped to this project.
Fix
Keep Projects active on every page that belongs to a project.
Visibility of system status; recognition rather than recall
Open in the auditThe sidebar toggle lives outside the sidebar
The collapse control sits in the global header, away from the panel it controls. A control is expected next to the thing it changes.
Fix
Move it into the sidebar, as a chevron at the top or a control at the foot. This frees the header for global and contextual navigation.
Match between system and the real world
Open in the auditBack and the page title compete for one row
“Back to project” sits on the same line as the page title, so escape navigation and page identity blur together.
Fix
Move Back to the left of the global header, into the space freed by the sidebar toggle, and give the title its own line.
Aesthetic and minimalist design; consistency and standards
Open in the auditEvery table opens details differently
Snapshots use a solid View button, and the name is plain text. Pipelines have a View details link and a clickable ID. Repositories and Projects make the name the link, in two different colours. The admin has to relearn how to open an item on every table.
Fix
Adopt the linked-name pattern everywhere. The primary identifier is the only link to the detail view. Remove View and View details.
Consistency and standards
Open in the auditHave a complex product problem?